Exam 18: Public Choice, Taxes, and the Distribution of Income
Exam 1: Economics: Foundations and Models444 Questions
Exam 2: Trade-Offs, Comparative Advantage, and the Market System498 Questions
Exam 3: Where Prices Come From: the Interaction of Demand and Supply475 Questions
Exam 4: Economic Efficiency, Government Price Setting, and Taxes419 Questions
Exam 5: Externalities, Environmental Policy, and Public Goods266 Questions
Exam 6: Elasticity: the Responsiveness of Demand and Supply295 Questions
Exam 7: The Economics of Health Care334 Questions
Exam 8: Firms, the Stock Market, and Corporate Governance278 Questions
Exam 9: Comparative Advantage and the Gains From International Trade379 Questions
Exam 10: Consumer Choice and Behavioral Economics302 Questions
Exam 11: Technology, Production, and Costs330 Questions
Exam 12: Firms in Perfectly Competitive Markets298 Questions
Exam 13: Monopolistic Competition: the Competitive Model in a More Realistic Setting276 Questions
Exam 14: Oligopoly: Firms in Less Competitive Markets262 Questions
Exam 15: Monopoly and Antitrust Policy271 Questions
Exam 16: Pricing Strategy263 Questions
Exam 17: The Markets for Labor and Other Factors of Production286 Questions
Exam 18: Public Choice, Taxes, and the Distribution of Income258 Questions
Exam 19: GDP: Measuring Total Production and Income266 Questions
Exam 20: Unemployment and Inflation292 Questions
Exam 21: Economic Growth, the Financial System, and Business Cycles257 Questions
Exam 22: Long-Run Economic Growth: Sources and Policies268 Questions
Exam 23: Aggregate Expenditure and Output in the Short Run306 Questions
Exam 24: Aggregate Demand and Aggregate Supply Analysis284 Questions
Exam 25: Money, Banks, and the Federal Reserve System280 Questions
Exam 26: Monetary Policy277 Questions
Exam 27: Fiscal Policy303 Questions
Exam 28: Inflation, Unemployment, and Federal Reserve Policy257 Questions
Exam 29: Macroeconomics in an Open Economy278 Questions
Exam 30: The International Financial System262 Questions
Select questions type
Figure 18-9 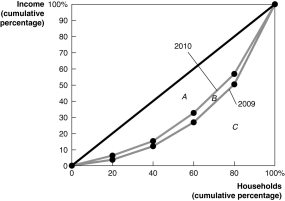 -Refer to Figure 18-9 to answer the following questions.
a. Did the distribution of income become more equal in 2010 that it was in 2009, or did it become less equal? Explain.
b. If area A = 1,600, area B = 200, and area C = 3,200, calculate the Gini coefficient for 2009 and the Gini coefficient for 2010.
-Refer to Figure 18-9 to answer the following questions.
a. Did the distribution of income become more equal in 2010 that it was in 2009, or did it become less equal? Explain.
b. If area A = 1,600, area B = 200, and area C = 3,200, calculate the Gini coefficient for 2009 and the Gini coefficient for 2010.
(Essay)
4.9/5  (43)
(43)
If the marginal tax rate is less than the average tax rate as taxable income increases, the tax structure is
(Multiple Choice)
4.8/5 (33)
When members of Congress vote to pass new legislation, they will
(Multiple Choice)
4.8/5 (39)
What is the relationship between market failure and government failure?
(Essay)
4.9/5 (44)
A Gini coefficient of ________ means that an income distribution is perfectly equal, and a Gini coefficient of ________ means the income distribution is perfectly unequal.
(Multiple Choice)
4.7/5 (30)
Table 18-1
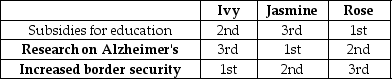 Suppose $1 billion is available in the budget and Congress is considering allocating the funds to one of the following three alternatives: 1) Subsidies for education, 2) Research on Alzheimer's or 3) Increased border security. Table 18-1 shows three voters' rankings of the alternatives.
-Refer to Table 18-1. Suppose a series of votes are taken in which each pair of alternatives is considered in turn. If the vote is between allocating funds to education subsidies and increased border security,
Suppose $1 billion is available in the budget and Congress is considering allocating the funds to one of the following three alternatives: 1) Subsidies for education, 2) Research on Alzheimer's or 3) Increased border security. Table 18-1 shows three voters' rankings of the alternatives.
-Refer to Table 18-1. Suppose a series of votes are taken in which each pair of alternatives is considered in turn. If the vote is between allocating funds to education subsidies and increased border security,
(Multiple Choice)
4.9/5 (38)
A key assumption of the public choice model is that government policymakers will pursue their own self-interests. Economists assume that consumers and firms pursue their own self-interests when they interact in competitive markets and this interaction results in efficient economic outcomes. Does the pursuit of self-interest by policymakers result in efficient economic outcomes?
(Essay)
4.8/5 (38)
Table 18-4
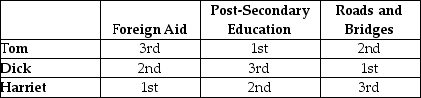 -Refer to Table 18-4. The table above outlines the rankings of three members of the U.S. House of Representatives on three spending alternatives. Assume that Congress can spend additional revenue on only one of the three spending alternatives and that Tom, Dick and Harriet, all members of the House of Representatives, participate in a series of votes in which they are to determine which of the spending alternatives should receive funding. Three votes will be taken: (1) Foreign Aid and Post-Secondary Education (2) Foreign Aid and Roads and Bridges and (3) Post-Secondary Education and Roads and Bridges.
Determine whether the voting paradox will occur as a result of these votes.
-Refer to Table 18-4. The table above outlines the rankings of three members of the U.S. House of Representatives on three spending alternatives. Assume that Congress can spend additional revenue on only one of the three spending alternatives and that Tom, Dick and Harriet, all members of the House of Representatives, participate in a series of votes in which they are to determine which of the spending alternatives should receive funding. Three votes will be taken: (1) Foreign Aid and Post-Secondary Education (2) Foreign Aid and Roads and Bridges and (3) Post-Secondary Education and Roads and Bridges.
Determine whether the voting paradox will occur as a result of these votes.
(Essay)
4.8/5 (30)
Both presidents Kennedy and Reagan proposed significant cuts in income taxes. Opponents of these tax cut proposals argued that
(Multiple Choice)
4.8/5 (39)
Compare the distribution of income in the United States with the distribution of income in other high-income countries.
(Essay)
4.8/5 (28)
The decision to make the U.S. income tax system progressive was
(Multiple Choice)
4.8/5 (43)
Suppose the government wants to finance housing for low-income families by placing a tax on the purchase of luxury homes. Assume the government defines a luxury home as a home that is purchased for at least $1 million. This tax is consistent with the
(Multiple Choice)
4.8/5 (33)
A tax is efficient if it imposes a small excess burden relative to the tax revenue it raises.
(True/False)
4.8/5 (35)
Which of the following statements concerning the federal corporate income tax is true?
(Multiple Choice)
4.9/5 (42)
Sheldon Cleaver commented on the difficulty people have in overcoming poverty in the United States: "Most people whose incomes fall below the poverty line have difficulty pulling themselves above the line in future years. In this sense, poverty becomes a vicious cycle. I believe the psychological damage households face when they are branded with the 'poverty' label in our society is a major factor in their remaining in poverty. Despair is a major reason why the percentage of people with incomes that lie below the poverty line never falls below 10 percent." Which of the following correctly evaluates Cleaver's statement?
(Multiple Choice)
4.9/5 (40)
A proportional tax is a tax for which people with lower incomes
(Multiple Choice)
4.8/5 (41)
Economist Kenneth Arrow has shown mathematically that no system of voting will consistently represent the underlying preferences of voters. This finding is called
(Multiple Choice)
4.8/5 (28)
Figure 18-6 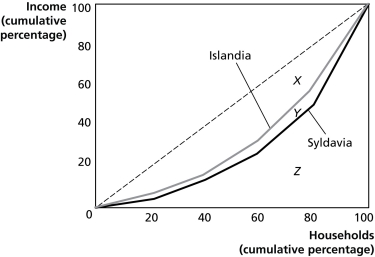 Figure 18-6 shows the Lorenz curves for Islandia and Syldavia.
-Refer to Figure 18-6. Which country has the more unequal distribution of income?
Figure 18-6 shows the Lorenz curves for Islandia and Syldavia.
-Refer to Figure 18-6. Which country has the more unequal distribution of income?
(Multiple Choice)
4.7/5 (43)
Filters
- Essay(0)
- Multiple Choice(0)
- Short Answer(0)
- True False(0)
- Matching(0)