Exam 7: Linear Regression
Exam 1: Stats Starts Here33 Questions
Exam 2: Displaying and Describing Categorical Data70 Questions
Exam 3: Displaying and Summarizing Quantitative Data148 Questions
Exam 4: Understanding and Comparing Distributions46 Questions
Exam 5: The Standard Deviation As a Ruler and the Normal Model111 Questions
Exam 6: Scatterplots, association, and Correlation78 Questions
Exam 7: Linear Regression71 Questions
Exam 8: Regression Wisdom32 Questions
Exam 9: Understanding Randomness26 Questions
Exam 10: Sample Surveys64 Questions
Exam 11: Experiments and Observational Studies80 Questions
Exam 12: From Randomness to Probability69 Questions
Exam 13: Probability Rules95 Questions
Exam 14: Random Variables215 Questions
Exam 15: Sampling Distribution Models51 Questions
Exam 16: Confidence Intervals for Proportions71 Questions
Exam 17: Testing Hypotheses About Proportions44 Questions
Exam 18: More About Tests67 Questions
Exam 19: Comparing Two Proportions53 Questions
Exam 20: Inferences About Means123 Questions
Exam 21: Comparing Means50 Questions
Exam 22: Paired Samples and Blocks35 Questions
Exam 23: Comparing Counts76 Questions
Exam 24: Inferences for Regression57 Questions
Exam 25: Analysis of Variance39 Questions
Exam 26: Multifactor Analysis of Variance22 Questions
Exam 27: Multiple Regression22 Questions
Exam 28: Multiple Regression Wisdom21 Questions
Exam 29: Rank-Based Nonparametric Tests29 Questions
Exam 30: The Bootstrap27 Questions
Select questions type
A golf ball is dropped from 15 different heights (in cm)and the height of the bounce is recorded (in cm).The regression analysis gives the model drop.A golf ball dropped from 61 cm bounced a height whose residual is -1.8 cm.What is the bounce height?
(Multiple Choice)
4.8/5  (29)
(29)
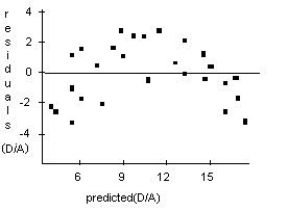
A forester would like to know how big a maple tree might be at age 50 years.She gathers data from some trees that have been cut down,and plots the diameters (in inches)of the trees against their ages (in years).First she makes a linear model.The scatterplot and residuals plot are shown.Do you think the linear model is appropriate? Explain. 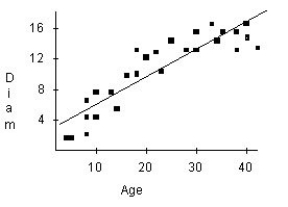
(Essay)
4.7/5 (38)
A random sample of 150 yachts sold in the Canada last year was taken.A regression analysis to predict the price (in thousands of dollars)from length (in metres)was completed.A linear model is appropriate.What are the units of the slope?
(Multiple Choice)
4.7/5 (35)
A sociology student does a study to determine whether people who exercise live longer.He claims that someone who exercises 7 days a week will live 15 years longer than someone who doesn't exercise at all.
(Multiple Choice)
4.8/5 (33)
When checking the "Straight Enough" condition,which is the best graph to look at?
(Multiple Choice)
4.9/5 (36)
The relationship between the price of yachts (y)and their length (x)is analyzed.The mean length was 41 metres with a standard deviation of 11.The mean price was $84,000 with a standard deviation of 14,000.The correlation between the price and the length was 0.41.
(Multiple Choice)
4.9/5 (43)
The relationship between the number of games won during one season by an NHL team and the average attendance at their home games is analyzed.A regression analysis to predict the average attendance from the number of games won gives the model wins.Predict the average attendance of a team with 400 wins.Explain any possible problems with this prediction.
(Multiple Choice)
4.9/5 (39)
A random sample of 150 yachts sold in Canada last year was taken.A regression to predict the price (in thousands of dollars)from length (in metres)has an What is correlation between length and price?
(Multiple Choice)
5.0/5 (36)
A golf ball was dropped from 8 different heights.The drop height and the bounce height were recorded. Drop Height () Bounce Height () 96 73 84 65 72 55 60 46 48 38 36 29 24 19 12 8
(Multiple Choice)
4.8/5 (35)
A golf ball is dropped from 15 different heights (in cm)and the height of the bounce is recorded (in cm).The regression analysis gives the model drop.A golf ball dropped from 61 cm bounced 46.44 cm.What is the residual for this bounce height?
(Multiple Choice)
4.8/5 (35)
The relationship between the number of games won by an NHL team and the average attendance at their home games is analyzed.A regression analysis to predict the average attendance from the number of games won gives the model wins.One team averaged 14,865 fans at each game and won 49 times.Calculate the residual for this team and explain what it means.
(Multiple Choice)
4.9/5 (32)
The relationship between the number of games won by an NHL team and the average attendance at their home games is analyzed.A regression to predict the average attendance from the number of games won has an Interpret this statistic.
(Multiple Choice)
4.8/5 (33)
If the linear correlation between shoe size and height is 0.758 and Dave is 2 standard deviations above the mean in shoe size,what would you predict is Dave's height with respect to the mean height?
(Multiple Choice)
4.8/5 (38)
Doctors studying how the human body assimilates medication inject some patients with penicillin,and then monitor the concentration of the drug (in units/cc)in the patients' blood for seven hours.First they tried to fit a linear model.The regression analysis and residuals plot are shown.Is that estimate likely to be accurate,too low,or too high? Explain. Dependent variable is: Concentration
No Selector
R squared R squared (adjusted)
with degrees of freedom
Source Sum of Squares df Mean Square F-ratio Regression 4900.55 1 4900.55 407 Residual 494.199 41 12.0536
Variable Coefficient s.e. of Coeff t-ratio prob Constant 40.3266 1.295 31.1 S 0.0001 Time -5.95956 0.2956 -20.2 S 0.0001 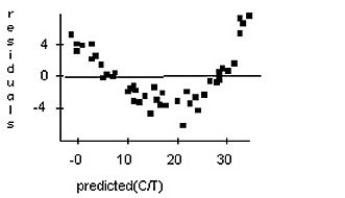
(Essay)
4.8/5 (36)
The relationship between the number of games won by an NHL team (x)and the average attendance at their home games (y)is analyzed.The mean number of games won was 70 with a standard deviation of 16.The mean attendance was 6993 with a standard deviation of 1400.The correlation between the games won and attendance was 0.47.
(Multiple Choice)
4.7/5 (41)
A golf ball is dropped from 15 different heights (in cm)and the height of the bounce is recorded (in cm.)The regression analysis gives the model drop.Predict the height of the bounce if dropped from 64 cm.
(Multiple Choice)
4.8/5 (31)
A random sample of 150 yachts sold in Canada last year was taken.A regression to predict the price (in thousands of dollars)from length (in feet)has an = 19.00%.What would you predict about the price of the yacht whose length was one standard deviation above the mean?
(Multiple Choice)
4.7/5 (39)
Filters
- Essay(0)
- Multiple Choice(0)
- Short Answer(0)
- True False(0)
- Matching(0)