Exam 6: Scatterplots, association, and Correlation
Exam 1: Stats Starts Here33 Questions
Exam 2: Displaying and Describing Categorical Data70 Questions
Exam 3: Displaying and Summarizing Quantitative Data148 Questions
Exam 4: Understanding and Comparing Distributions46 Questions
Exam 5: The Standard Deviation As a Ruler and the Normal Model111 Questions
Exam 6: Scatterplots, association, and Correlation78 Questions
Exam 7: Linear Regression71 Questions
Exam 8: Regression Wisdom32 Questions
Exam 9: Understanding Randomness26 Questions
Exam 10: Sample Surveys64 Questions
Exam 11: Experiments and Observational Studies80 Questions
Exam 12: From Randomness to Probability69 Questions
Exam 13: Probability Rules95 Questions
Exam 14: Random Variables215 Questions
Exam 15: Sampling Distribution Models51 Questions
Exam 16: Confidence Intervals for Proportions71 Questions
Exam 17: Testing Hypotheses About Proportions44 Questions
Exam 18: More About Tests67 Questions
Exam 19: Comparing Two Proportions53 Questions
Exam 20: Inferences About Means123 Questions
Exam 21: Comparing Means50 Questions
Exam 22: Paired Samples and Blocks35 Questions
Exam 23: Comparing Counts76 Questions
Exam 24: Inferences for Regression57 Questions
Exam 25: Analysis of Variance39 Questions
Exam 26: Multifactor Analysis of Variance22 Questions
Exam 27: Multiple Regression22 Questions
Exam 28: Multiple Regression Wisdom21 Questions
Exam 29: Rank-Based Nonparametric Tests29 Questions
Exam 30: The Bootstrap27 Questions
Select questions type
The table contains the daily study time for students from Statistics 101 and the grades on their quiz. Minutes on Grade on Homework Quiz 15 2 35 5 45 5 60 10 65 9 35 7 50 8 50 7 10 1
(Essay)
4.8/5  (44)
(44)
The paired data below consist of the height of children (in cm)and their reading scores. Height () Reading Scores 117.5 62.9 128.9 67.9 122.6 64.9 131.4 71.9 132.7 72.9 136.5 75.9 120.0 64.9 139.1 76.9
(Multiple Choice)
4.9/5 (34)
Litres remaining in a tank of gas,kilometres driven since filling up.
(Multiple Choice)
4.9/5 (31)
A scientist collects data to predict the wheat yield (in bushels per acre)based on rainfall (in millimetres).The results are recorded in the table below. Rainfall () Wheat Yield (bushels per acre) 11.9 61.8 8 26.4 11.6 51.2 18.4 79.1 9 41.5 10.9 42.9 15.1 71 13.5 54.6
(Multiple Choice)
4.9/5 (38)
Adam would like to buy a used car,and collected several data to evaluate the best model (such as age,price,weight,etc.)Thanks to a scatterplot,he established that the relation between age and weight is somewhat linear.He calculated that the correlation between age and weight is 0.515.Describe the association.
(Multiple Choice)
4.8/5 (41)
The relationship between two quantities x and y is examined,and the association is shown in the scatterplot below. 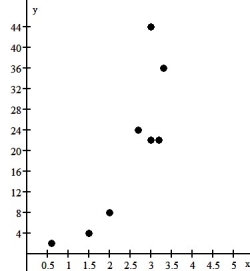 Describe the association between these variables shown in the scatterplot.
(Multiple Choice)
4.8/5 (38)
Almost all of the acidity of soda pop comes from the phosphoric acid which is added to give them a sharper flavor.Is there a relation between the pH of the soda and the amount of phosphoric acid (in grams)? The pH and phosphoric acid content of 12 ounces of several brands of soda are shown on the following scatterplot.The correlation between pH and phosphoric acid is .Describe the association. 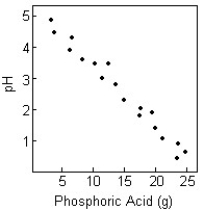
(Multiple Choice)
4.8/5 (40)
Data collected from students in Statistics classes included their heights (in inches)and weights (in pounds).For the and weights,the correlation is 0.653.Suppose the variable weight is recorded in kilograms rather than in pounds.What will be the correlation? 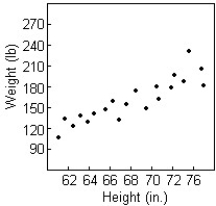
(Multiple Choice)
4.9/5 (27)
Owners of a new computer store tracked sales (in thousands)for the first 12 days,and displayed the data in a scatterplot.Make a histogram of the daily sales since the shop has been in business. 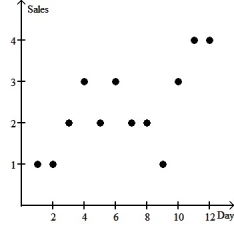
(Essay)
4.9/5 (32)
A clothes shop owner tries to predict the winter collection sales by displaying the coats sales (in dollars)and the outside temperature (in degrees Fahrenheit)on the following scatterplot.He calculates that the correlation between coats sales and temperature is -0.737.Suppose the variable temperature is recorded in degrees Celsius rather than in degrees Fahrenheit.What will be the correlation? 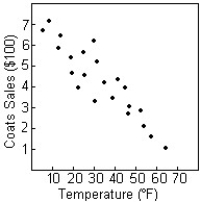
(Multiple Choice)
4.8/5 (31)
Dioxins are a class of long-lived and highly toxic pollutants.The topsoil concentration of dioxins in parts per million (ppm)are shown in the table below as a function of the distance from the dump. Dioxin Distance from concentration dump (metres) ( ppm) 21 423 42 235 49 140 79 65 102 35 128 45 157 22 204 14 248 9 Re-express the dioxin concentration by taking the reciprocal square root of the data,then plot the re-expressed data as a scatterplot. 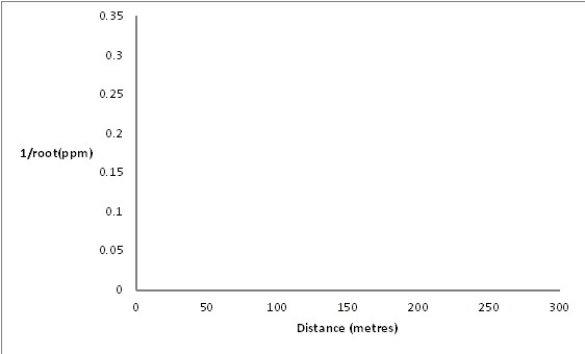
(Essay)
4.9/5 (36)
The relationship between two quantities x and y is examined,and the association is shown in the scatterplot below. 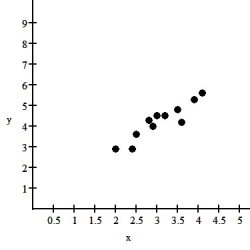 Describe the association between these variables shown in the scatterplot.
(Multiple Choice)
4.8/5 (50)
Oranges: circumference (centimetres),oranges: weight (grams)
(Multiple Choice)
4.8/5 (40)
A study shows that the amount of chocolate consumed in Canada and the number of automobile accidents is positively related.Find the lurking variable,if there is one.
(Multiple Choice)
4.7/5 (40)
Filters
- Essay(0)
- Multiple Choice(0)
- Short Answer(0)
- True False(0)
- Matching(0)