Exam 6: Scatterplots, association, and Correlation
Exam 1: Stats Starts Here33 Questions
Exam 2: Displaying and Describing Categorical Data70 Questions
Exam 3: Displaying and Summarizing Quantitative Data148 Questions
Exam 4: Understanding and Comparing Distributions46 Questions
Exam 5: The Standard Deviation As a Ruler and the Normal Model111 Questions
Exam 6: Scatterplots, association, and Correlation78 Questions
Exam 7: Linear Regression71 Questions
Exam 8: Regression Wisdom32 Questions
Exam 9: Understanding Randomness26 Questions
Exam 10: Sample Surveys64 Questions
Exam 11: Experiments and Observational Studies80 Questions
Exam 12: From Randomness to Probability69 Questions
Exam 13: Probability Rules95 Questions
Exam 14: Random Variables215 Questions
Exam 15: Sampling Distribution Models51 Questions
Exam 16: Confidence Intervals for Proportions71 Questions
Exam 17: Testing Hypotheses About Proportions44 Questions
Exam 18: More About Tests67 Questions
Exam 19: Comparing Two Proportions53 Questions
Exam 20: Inferences About Means123 Questions
Exam 21: Comparing Means50 Questions
Exam 22: Paired Samples and Blocks35 Questions
Exam 23: Comparing Counts76 Questions
Exam 24: Inferences for Regression57 Questions
Exam 25: Analysis of Variance39 Questions
Exam 26: Multifactor Analysis of Variance22 Questions
Exam 27: Multiple Regression22 Questions
Exam 28: Multiple Regression Wisdom21 Questions
Exam 29: Rank-Based Nonparametric Tests29 Questions
Exam 30: The Bootstrap27 Questions
Select questions type
A shop owner tries to predict the winter collection sales by displaying coat sales (in dollars)and the outside temperature (in degrees Fahrenheit)in the following scatterplot.Make a histogram of the coat sales. 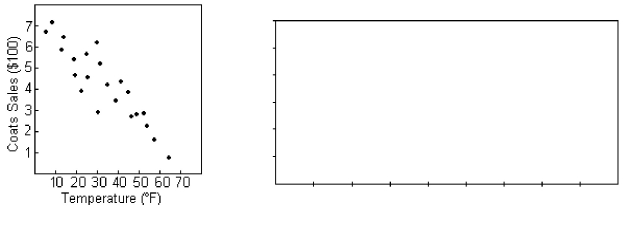
(Essay)
4.9/5  (36)
(36)
A Science instructor assigns a group of students to investigate the relationship between their grade point average and their consistency in studying.The correlation between GPA and studying consistency is 0.857.Assume that the relation is linear.Describe the association.
(Multiple Choice)
4.7/5 (43)
A teacher studied students' grades and established with a scatterplot a strong correlation between SAT scores and college grades.Find the lurking variable,if there is one.
(Multiple Choice)
4.8/5 (39)
Fast food is often considered unhealthy because much of it is high in both fat and calories.But are the two related? Here are the fat (in grams)and calories contents of several brands of burgers.If the fat was recorded in kilograms,how would this change the correlation? Suppose the relation is linear. Fat () Calories 20 410 35 570 36 590 39 580 41 650 42 680 45 660
(Multiple Choice)
4.9/5 (31)
A study is conducted on the causes of flat feet,and shows a linear relation between age and having mechanical disturbances of the foot.The correlation between these two variables is 0.84.The report concludes that older people have greater chances to have flat feet.Is the calculation of the correlation appropriate?
(Multiple Choice)
4.8/5 (35)
Owners of a small shop tracked the number of customers and the sales each hour for a 7 hour period.The results are recorded in the table below.
(Multiple Choice)
4.7/5 (25)
Data collected from 20 students in Statistics classes included their heights (in inches)and weights (in pounds),and are displayed in the following scatterplot.Make a histogram of the weights of the children. 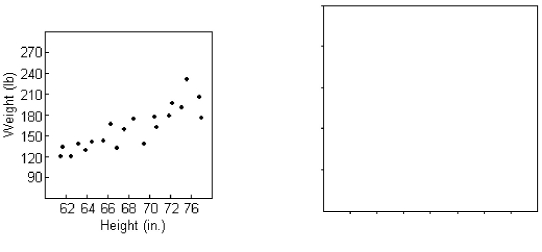
(Essay)
4.8/5 (36)
A shop owner tries to predict heater sales by displaying the sales of hot chocolate and heaters on the following scatterplot.Does the scatterplot of hot chocolate sales and heater sales indicate that it is appropriate to calculate the correlation? 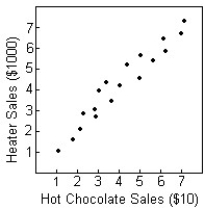
(Multiple Choice)
4.9/5 (43)
The table contains the weights (in kg)and heights (in cm)of 9 randomly selected adults. Weight () Height () 59 165 70 191 68 183 61 173 65 173 65 165 56 152 59 157 58 178
(Essay)
4.8/5 (29)
The table shows the number of years of teaching experience for 9 certified high-school teachers and their weekly salaries (in dollars). Years of Experience Weekly Salaries 19 1,050 17 1,050 8 850 5 800 11 950 26 1,100 20 1,050 29 1,150 12 950
(Essay)
4.8/5 (34)
A study was conducted to compare the average time spent in the lab each week versus course grade for computer students.The results are recorded in the table below. Number of hours spent in lab Grade (percent)
10 96
11 51
16 62
9 58
7 89
15 81
16 46
10 51
(Multiple Choice)
5.0/5 (40)
A researcher studies children in elementary school and finds a strong positive linear association between shoe size and reading skills.Find the lurking variable,if there is one.
(Multiple Choice)
4.8/5 (41)
A survey was conducted in 20 counties to determine the percentage of teenagers who had used marijuana and other drugs.Data shown on the following scatterplot indicate a correlation of 0.972 between the percent of teens who have used marijuana and the percent who have used other drugs.Describe the association. 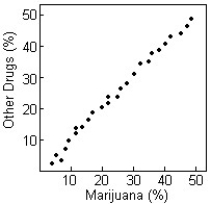
(Multiple Choice)
5.0/5 (29)
The relationship between two quantities X and Y is examined,and the association is shown in the scatterplot below. 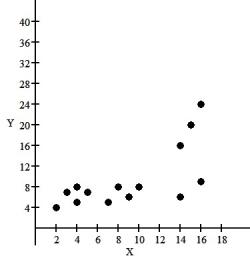 Should you re-express these data before trying to fit a model? Explain.
(Multiple Choice)
4.7/5 (43)
A survey was conducted in 26 counties to determine the percentage of teenagers who had used marijuana and other drugs.Data are displayed in the following scatterplot.Make a histogram of the other drugs. 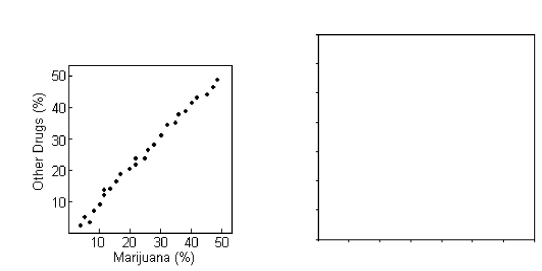
(Essay)
4.8/5 (34)
Filters
- Essay(0)
- Multiple Choice(0)
- Short Answer(0)
- True False(0)
- Matching(0)