Exam 6: Scatterplots, association, and Correlation
Exam 1: Stats Starts Here33 Questions
Exam 2: Displaying and Describing Categorical Data70 Questions
Exam 3: Displaying and Summarizing Quantitative Data148 Questions
Exam 4: Understanding and Comparing Distributions46 Questions
Exam 5: The Standard Deviation As a Ruler and the Normal Model111 Questions
Exam 6: Scatterplots, association, and Correlation78 Questions
Exam 7: Linear Regression71 Questions
Exam 8: Regression Wisdom32 Questions
Exam 9: Understanding Randomness26 Questions
Exam 10: Sample Surveys64 Questions
Exam 11: Experiments and Observational Studies80 Questions
Exam 12: From Randomness to Probability69 Questions
Exam 13: Probability Rules95 Questions
Exam 14: Random Variables215 Questions
Exam 15: Sampling Distribution Models51 Questions
Exam 16: Confidence Intervals for Proportions71 Questions
Exam 17: Testing Hypotheses About Proportions44 Questions
Exam 18: More About Tests67 Questions
Exam 19: Comparing Two Proportions53 Questions
Exam 20: Inferences About Means123 Questions
Exam 21: Comparing Means50 Questions
Exam 22: Paired Samples and Blocks35 Questions
Exam 23: Comparing Counts76 Questions
Exam 24: Inferences for Regression57 Questions
Exam 25: Analysis of Variance39 Questions
Exam 26: Multifactor Analysis of Variance22 Questions
Exam 27: Multiple Regression22 Questions
Exam 28: Multiple Regression Wisdom21 Questions
Exam 29: Rank-Based Nonparametric Tests29 Questions
Exam 30: The Bootstrap27 Questions
Select questions type
A forester would like to know how big a maple tree might be at age 50 years.She gathers data from some trees that have been cut down,and plots the diameters (in inches)of the trees against their ages (in years).First she makes a linear model.Describe the association shown in the scatterplot. 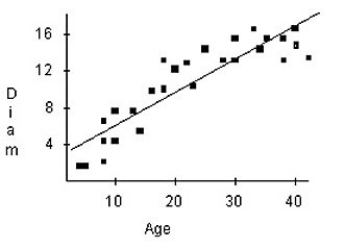
(Essay)
4.7/5  (38)
(38)
The paired data below consist of the height (in cm)of children and their reading scores.If the height was recorded in inches,what would be the correlation? Height () Reading Scores 117.5 66 128.9 71 122.6 68 131.45 75 132.7 76 136.5 79 120 68 139.1 80
(Multiple Choice)
4.8/5 (34)
A reporter investigates speeding on roads in a county and finds a correlation of 0.961 between the number of speeding tickets and the numbers of kilometres of well-paved roads.Assuming that the relation is linear,does it mean that there are more speeding tickets on well-paved roads?
(Multiple Choice)
4.8/5 (48)
The owner of a small manufacturing plant employs nine people.As part of their personnel file,he asked each one to record the distance,in km,they travel one way from home to work and the time it takes in minutes. Time () Distance () 5.2 18 2.3 8 4.1 10 6.4 19 3.8 8 1.8 6 7.1 26 9.5 32 1.8 8
(Essay)
4.8/5 (34)
Owners of a new appliances store tracked sales (in thousands)for the first 10 days,and displayed the data in a scatterplot.Make a histogram of the daily sales since the shop has been in business. 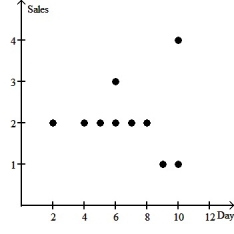
(Essay)
4.9/5 (41)
A reporter studied the causes of a fire to a house,and established thanks to a scatterplot a strong correlation between the damages (in dollars)and the number of firefighters at the scene.Find the lurking variable,if there is one.
(Multiple Choice)
4.7/5 (31)
The following table gives the total sales (revenue)and profits for 8 retailers.
(Essay)
4.9/5 (47)
A ceramics factory can fire six large batches of pottery per day.Sometimes in the process a few of the pieces break.In order to understand the problem better,the factory records the number of broken pieces in each batch for 4 days and then creates the scatterplot shown.Make a histogram showing the distribution of the number of broken pieces in the 24 batches of pottery examined. 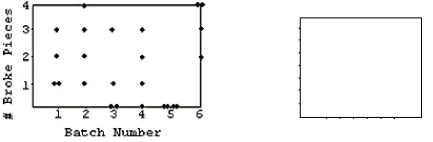
(Essay)
4.8/5 (44)
The relationship between two quantities X and Y is examined,and the association is shown in the scatterplot below. 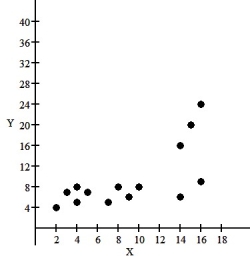 What re-expression of Y should be tried as a starting point?
(Multiple Choice)
4.9/5 (45)
One of the important factors determining a car's fuel efficiency is its weight.This relationship is examined for 11 cars,and the association is shown in the scatterplot below. 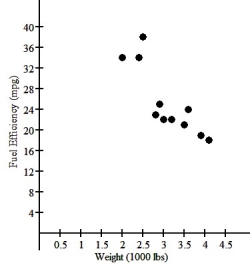 Describe the association between these variables shown in the scatterplot.
(Multiple Choice)
4.8/5 (32)
A study is conducted on insects growth based on hydrometry.The correlation found between insects growth and hydrometry is 0.05.A journalist concludes that a low correlation between insects growth and hydrometry shows that insects can reproduce easily in a dry climate.Do you agree with this interpretation?
(Multiple Choice)
4.8/5 (43)
Two different tests are designed to measure employee productivity and dexterity.Several employees are randomly selected and tested with these results. Productivity Dexterity 23 49 25 53 28 59 21 42 21 47 25 53 26 55 30 63 34 67 36 75
(Multiple Choice)
4.9/5 (44)
Oranges: circumference (centimetres),oranges: weight (grams)
(Multiple Choice)
4.7/5 (30)
Below are the Olympic gold medal performances in the men's high jump from 1960 to 1984. Year High Jump (in.) 1960 85.25 1964 85.75 1968 88.25 1972 87.75 1976 88.50 1980 92.50 1984 92.50 1988 93.75 1992 92.25 1996 94.00 2000 92.50 2004 93.00 2008 93.00 2012 93.75 
(Essay)
4.9/5 (38)
To get the best deal on a microwave oven,Amanda called six appliance stores and asked the cost and volume of several models.The prices and volumes she was quoted are listed below. Volume ( cu.ft) Price (\ ) 1.9 183 0.5 119 2.2 119 1.8 417 1.5 463 1 200 1.5 279 0.7 49 1.5 349
(Essay)
4.8/5 (43)
Filters
- Essay(0)
- Multiple Choice(0)
- Short Answer(0)
- True False(0)
- Matching(0)