Exam 4: Understanding and Comparing Distributions
Exam 1: Stats Starts Here33 Questions
Exam 2: Displaying and Describing Categorical Data70 Questions
Exam 3: Displaying and Summarizing Quantitative Data148 Questions
Exam 4: Understanding and Comparing Distributions46 Questions
Exam 5: The Standard Deviation As a Ruler and the Normal Model111 Questions
Exam 6: Scatterplots, association, and Correlation78 Questions
Exam 7: Linear Regression71 Questions
Exam 8: Regression Wisdom32 Questions
Exam 9: Understanding Randomness26 Questions
Exam 10: Sample Surveys64 Questions
Exam 11: Experiments and Observational Studies80 Questions
Exam 12: From Randomness to Probability69 Questions
Exam 13: Probability Rules95 Questions
Exam 14: Random Variables215 Questions
Exam 15: Sampling Distribution Models51 Questions
Exam 16: Confidence Intervals for Proportions71 Questions
Exam 17: Testing Hypotheses About Proportions44 Questions
Exam 18: More About Tests67 Questions
Exam 19: Comparing Two Proportions53 Questions
Exam 20: Inferences About Means123 Questions
Exam 21: Comparing Means50 Questions
Exam 22: Paired Samples and Blocks35 Questions
Exam 23: Comparing Counts76 Questions
Exam 24: Inferences for Regression57 Questions
Exam 25: Analysis of Variance39 Questions
Exam 26: Multifactor Analysis of Variance22 Questions
Exam 27: Multiple Regression22 Questions
Exam 28: Multiple Regression Wisdom21 Questions
Exam 29: Rank-Based Nonparametric Tests29 Questions
Exam 30: The Bootstrap27 Questions
Select questions type
The weekly salaries (in dollars)of 24 randomly selected employees of a company are shown below. 310 320 450 460 470 500 520 540
580 600 650 700 710 840 870 900
1000 1200 1250 1300 1400 1720 2500 3700
(Multiple Choice)
4.8/5  (28)
(28)
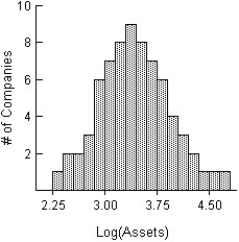
Here is a histogram of the assets (in millions of dollars)of 71 companies. 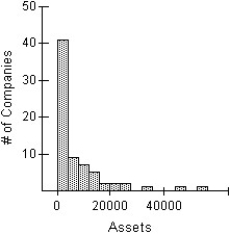 Which of the following is an appropriate re-expression of these data? (More than one may be appropriate.)
I
Which of the following is an appropriate re-expression of these data? (More than one may be appropriate.)
I  II
II
 III
III 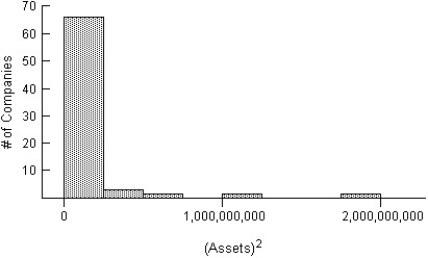
(Multiple Choice)
4.8/5 (37)
The Ontario Ministry of Education collects data on the number of years of teaching experience of high school teachers.A sample taken this year of 19 high school teachers yielded the following data on number of years of teaching experience. 16 28 1 33 15
6 18 7 20 14
17 19 16 10 21
29 14 39 18
(Multiple Choice)
4.8/5 (36)
The test scores of 15 students are listed below. 33 60 50 65 66
68 70 73 74 77
78 82 87 90 99
(Multiple Choice)
4.9/5 (36)
The centre for health in a certain country compiles data on the length of stay by patients in short-term hospitals and publishes its statistical findings annually.Data from a sample of 67 male patients and 63 female patients on length of stay (in days)are displayed in the histograms below. 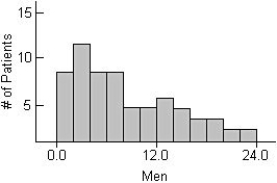
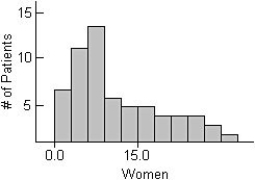 i)What would you suggest be changed about these histograms to make them easier to compare?
ii)Describe these distributions by writing a few sentences comparing the duration of hospitalization for men and women.
iii)Can you suggest a reason for the peak in women's length of stay?
i)What would you suggest be changed about these histograms to make them easier to compare?
ii)Describe these distributions by writing a few sentences comparing the duration of hospitalization for men and women.
iii)Can you suggest a reason for the peak in women's length of stay?
(Multiple Choice)
4.9/5 (38)
The weights (in kilograms)of 27 dogs are listed below. 1.2 2.0 2.2 2.2 2.4 2.5 2.5 2.5 2.6 2.6 2.6 2.6 2.6 2.7 2.8 2.8 2.8 2.9 2.9 2.9 3.0 3.0 3.1 3.1 3.3 3.6 4.2
(Multiple Choice)
4.8/5 (35)
Here are the test scores of 32 students: 35 37 41 44 46 48 53 55
56 57 59 63 65 66 68 69
70 71 74 74 75 77 78 79
80 82 83 86 89 92 95 99
(Multiple Choice)
4.8/5 (31)
The histograms show the cost of living,in dollars,for 32 Canadian cities.The histogram on the left shows the cost of living for the 32 cities using bins $10 wide,and the histogram on the right displays the same data using bins that are $6 wide. 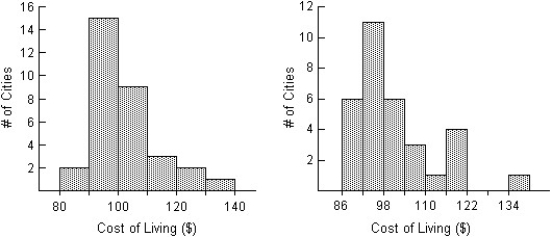 Compare the distributions (shape,centre,spread,unusual features).
(Multiple Choice)
4.8/5 (31)
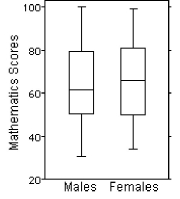
Here are the summary statistics for mathematics scores for one high school graduating class,and the parallel boxplots comparing the scores of male and female students.Write a brief report on these results.Be sure to discuss shape,centre,and spread of the scores. Mean Median SD Min Max Q1 Q3 Male 17 60 63 18.6 30 100 52 78 Female 18 65 66 17.7 36 98 50 80
(Multiple Choice)
4.8/5 (33)
Here are boxplots of the points scored during the first 10 games of the basketball season for both Caroline and Alexandra.Summarize the similarities and differences in their performance so far. 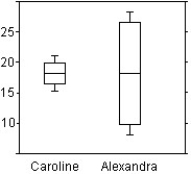
(Multiple Choice)
4.9/5 (29)
Do men and women run a 5-kilometre race at the same pace? Here are boxplots of the time (in minutes)for a race recently run in Victoria,B.C.Write a brief report discussing what these data show. 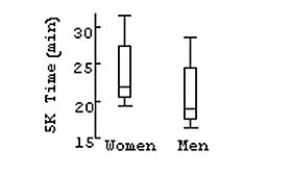
(Multiple Choice)
4.8/5 (32)
Here is a histogram of the assets (in millions of dollars)of 71 companies.The logarithm re-expression of assets is also given.In the logarithm re-expression,what does the value 2.25 actually indicate about the company's assets? 
(Multiple Choice)
4.8/5 (28)
The boxplots display case prices (in dollars)of white wines produced by three vineyards in south-western Ontario.Describe these wine prices. 
(Multiple Choice)
4.7/5 (32)
Here is a histogram of the assets (in millions of dollars)of 71 companies.  Which of the following is the most appropriate re-expression of these data? Explain.
I
Which of the following is the most appropriate re-expression of these data? Explain.
I 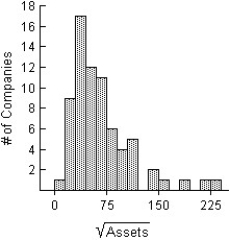 II
II  III
III 
(Multiple Choice)
4.8/5 (35)
The boxplots display case prices (in dollars)of white wines produced by three vineyards in south-western Ontario.Which vineyard produces the most expensive wine? 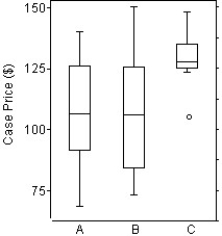
(Multiple Choice)
4.9/5 (42)
Filters
- Essay(0)
- Multiple Choice(0)
- Short Answer(0)
- True False(0)
- Matching(0)