Exam 4: Understanding and Comparing Distributions
Exam 1: Stats Starts Here33 Questions
Exam 2: Displaying and Describing Categorical Data70 Questions
Exam 3: Displaying and Summarizing Quantitative Data148 Questions
Exam 4: Understanding and Comparing Distributions46 Questions
Exam 5: The Standard Deviation As a Ruler and the Normal Model111 Questions
Exam 6: Scatterplots, association, and Correlation78 Questions
Exam 7: Linear Regression71 Questions
Exam 8: Regression Wisdom32 Questions
Exam 9: Understanding Randomness26 Questions
Exam 10: Sample Surveys64 Questions
Exam 11: Experiments and Observational Studies80 Questions
Exam 12: From Randomness to Probability69 Questions
Exam 13: Probability Rules95 Questions
Exam 14: Random Variables215 Questions
Exam 15: Sampling Distribution Models51 Questions
Exam 16: Confidence Intervals for Proportions71 Questions
Exam 17: Testing Hypotheses About Proportions44 Questions
Exam 18: More About Tests67 Questions
Exam 19: Comparing Two Proportions53 Questions
Exam 20: Inferences About Means123 Questions
Exam 21: Comparing Means50 Questions
Exam 22: Paired Samples and Blocks35 Questions
Exam 23: Comparing Counts76 Questions
Exam 24: Inferences for Regression57 Questions
Exam 25: Analysis of Variance39 Questions
Exam 26: Multifactor Analysis of Variance22 Questions
Exam 27: Multiple Regression22 Questions
Exam 28: Multiple Regression Wisdom21 Questions
Exam 29: Rank-Based Nonparametric Tests29 Questions
Exam 30: The Bootstrap27 Questions
Select questions type
The weekly salaries (in dollars)of sixteen government workers are listed below. 690 578 813 630
728 546 469 614
502 677 685 350
530 787 477 1086
(Multiple Choice)
4.8/5  (35)
(35)
In a child psychology course,children took part in an experiment to determine how,while putting together a 10-piece puzzle,being able to view the completed picture affected the time required for the child to complete the puzzle.One group (NV)was not allowed to look at the picture on the cover of the puzzle box.A second group (VP)was allowed to view the picture on the cover of the box.Below are the boxplots of the original completion times and the boxplots of the log of the completion times. 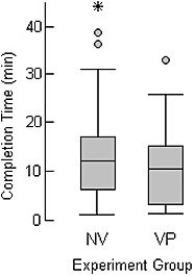
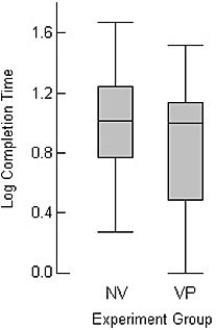 Is it better to analyze the original completion times or the log of the completion times? Explain.
(Essay)
4.8/5 (25)
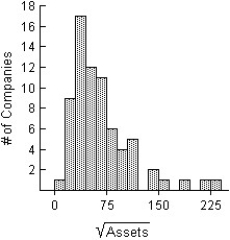
Here is a histogram of the assets (in millions of dollars)of 71 companies.The square root re-expression of assets is also given.In the square root re-expression,what does the value 45 actually indicate about the company's assets? 
(Multiple Choice)
4.7/5 (32)
Here is a histogram of the assets (in millions of dollars)of 71 companies.What aspect of this distribution makes it difficult to summarize,or to discuss,the centre and spread? What could be done with these data to make it easier to discuss the distribution? 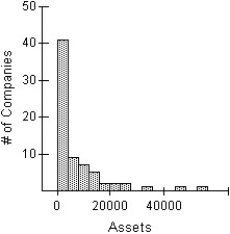
(Multiple Choice)
4.8/5 (32)
Filters
- Essay(0)
- Multiple Choice(0)
- Short Answer(0)
- True False(0)
- Matching(0)