Exam 3: Descriptive Statistics
Exam 1: An Introduction47 Questions
Exam 2: Laws, Ethics, and Issues47 Questions
Exam 3: Descriptive Statistics47 Questions
Exam 4: Reliability and Validity47 Questions
Exam 5: An Introduction to Norm-Referenced Assessment46 Questions
Exam 6: Curriculum-Based Assessment and Other Informal Measures45 Questions
Exam 7: Response to Intervention47 Questions
Exam 8: Academic Assessment47 Questions
Exam 9: Assessment of Behavior47 Questions
Exam 10: Measurement of Intelligence and Adaptive Behavior47 Questions
Exam 11: Special Considerations of Assessment in Early Childhood47 Questions
Exam 12: Special Considerations of Assessment in Transition35 Questions
Exam 13: Interpreting Assessment for Educational Intervention36 Questions
Select questions type
What does the vertical line in the normal distribution represent? 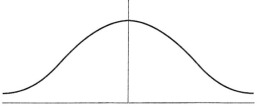
Free
(Multiple Choice)
4.7/5  (35)
(35)
Correct Answer: Verified
C
When students enroll in school and are provided with an identification number-a combination of letters and numbers-this number is on the ___ scale.
Free
(Multiple Choice)
4.8/5 (32)
Correct Answer:Verified
D
Variance is described as the degree or amount of dispersion in a data set.
Free
(True/False)
4.9/5 (40)
Correct Answer:Verified
True
Why should care be taken when interpreting results whose distributions are positively or negatively skewed?
(Essay)
5.0/5 (24)
When the mean score is represented as ± 2, what type of score is this?
(Multiple Choice)
4.9/5 (42)
Using the data set below, answer the questions that follow.
 -What is the range?
(Multiple Choice)
4.8/5 (36)
In a normal distribution, most students' scores fall at the edges of the bell curve.
(True/False)
4.8/5 (34)
Draw pictures of a negatively skewed distribution and a positively skewed distribution. Explain each.
(Essay)
4.8/5 (31)
A graph of class data is below. What is this type of graph called? 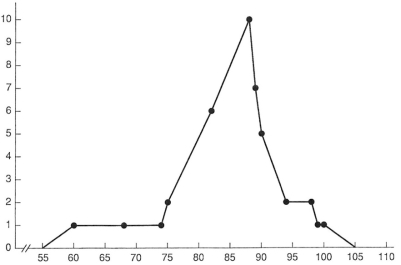
(Multiple Choice)
4.8/5 (40)
Using the data set below, answer the questions that follow.
-What is the mode?
(Multiple Choice)
4.7/5 (33)
What is a normal distribution and why is it important in understanding student performance?
(Essay)
4.9/5 (38)
Large sets of data are organized and understood through methods known as Measures of Central Tendency.
(True/False)
4.9/5 (33)
In order for a score to be considered significant it must be at least two standard deviations from the mean.
(True/False)
4.7/5 (34)
This term is used when a national sample of students of the same age/grade take the same assessment and establish a mean and standard deviation.
(Multiple Choice)
4.8/5 (35)
Organizing data to see how the data spread away from the mean is called
(Multiple Choice)
4.7/5 (34)
Filters
- Essay(0)
- Multiple Choice(0)
- Short Answer(0)
- True False(0)
- Matching(0)