Exam 20: Nonparametric Tests
Exam 1: Statistics and Data68 Questions
Exam 2: Tabular and Graphical Methods99 Questions
Exam 3: Numerical Descriptive Measures123 Questions
Exam 4: Basic Probability Concepts107 Questions
Exam 5: Discrete Probability Distributions118 Questions
Exam 6: Continuous Probability Distributions114 Questions
Exam 7: Sampling and Sampling Distributions110 Questions
Exam 8: Interval Estimation111 Questions
Exam 9: Hypothesis Testing111 Questions
Exam 10: Statistical Inference Concerning Two Populations104 Questions
Exam 11: Statistical Inference Concerning Variance96 Questions
Exam 12: Chi-Square Tests100 Questions
Exam 13: Analysis of Variance89 Questions
Exam 14: Regression Analysis116 Questions
Exam 15: Inference With Regression Models117 Questions
Exam 16: Regression Models for Nonlinear Relationships95 Questions
Exam 17: Regression Models With Dummy Variables117 Questions
Exam 18: Time Series and Forecasting103 Questions
Exam 19: Returns, Index Numbers and Inflation98 Questions
Exam 20: Nonparametric Tests99 Questions
Select questions type
Let positive daily S&P 500 returns define up days,and negative daily S&P 500 returns define down days.A stockbroker wants to know if the up and down days of the S&P 500 occur randomly.For 30 trading days,there were 17 up days,13 down days,four runs of up days,and four runs of down days.
A)Specify the competing hypotheses to determine whether S&P 500 up and down days occur at random.
B)What is the value of the Wald-Wolfowitz runs test statistic R?
C)At the 5% significance level,what is the decision and conclusion?
(Essay)
4.9/5  (38)
(38)
The Wilcoxon signed-rank test for a population median does not assume anything about the distribution of the population.
(True/False)
4.9/5 (42)
Exhibit 20.13.An energy analyst wants to test if U.S.oil production is random over time.The analyst has monthly production values for the two years.The analyst finds 12 months are above the median,12 months are below the median,6 runs are below the median,and 5 runs are above the median. Refer to Exhibit 20.13.For the Wald-Wolfowitz runs test,the value of R is:
(Multiple Choice)
4.8/5 (37)
Exhibit 20.6.A fund manager wants to know if the annual rate of return is greater for growth stocks (1)than value stocks (2).The fund manager collects data on the returns of growth and value funds.Below are the sample sizes and rank sums for the Wilcoxon rank-sum test.  Refer to Exhibit 20.6.Using the p-value approach and
  ,the appropriate conclusion is:
(Multiple Choice)
4.8/5 (41)
Exhibit 20.9.A shipping company believes there is a linear association between the weight of packages shipped and the cost.The following table shows the weight (in pounds)and cost (in dollars)of the last 7 packages shipped. 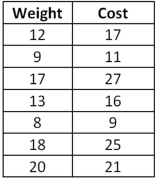 Refer to Exhibit 20.9.Using the critical value approach,the appropriate conclusion is:
(Multiple Choice)
5.0/5 (32)
Nonparametric tests do not require a level of measurement as strong as is necessary for parametric tests.
(True/False)
5.0/5 (47)
Exhibit 20.5.An accountant wants to know if the property taxes paid by clients that live in the city are different from those that live in the county.The property taxes paid by five clients from the city (1)and five clients from the county (2)are shown below (in dollars). 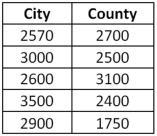 Refer to Exhibit 20.5.To determine if whether the medians of the taxes paid differ using the Wilcoxon rank-sum test,the competing hypotheses are:
(Multiple Choice)
4.9/5 (36)
Exhibit 20.4.Investment institutions usually have funds with different risk vs.reward prospectuses.A trading magazine wants to determine if the returns of high risk funds is greater than low risk funds.The magazine records the return of high and low risk funds for a sample of 22 institutions.For the Wilcoxon signed-rank test,where D = high risk return - low risk return,the value of the test statistic is  . Refer to Exhibit 20.4.Assuming that T follows a normal distribution,the value of the test statistic is
(Multiple Choice)
4.8/5 (33)
Exhibit 20.7.A marketing firm needs to replace its existing network provider,and is considering three different providers.A primary consideration is the amount of system down time.The following table contains the amount of network down-time (in hours)for the last five months for each network provider. 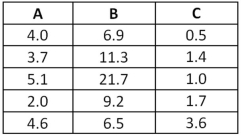 Refer to Exhibit 20.7.The p-value for the test is:
(Multiple Choice)
4.9/5 (45)
If the distributional assumptions of a parametric test are valid yet we choose to use a nonparametric test,the nonparametric test is more powerful.
(True/False)
4.8/5 (49)
Exhibit 20.10.SHY (NYSEARCA: SHY)is a 1-3 year Treasury bond fund which is considered to be a market neutral position.Using the S&P 500 as a benchmark and five years of monthly log-return data,the rank correlation coefficient of SHY with the S&P 500 is found to be  . Refer to Exhibit 20.10.Since the sample size is greater than 10,
  can be assumed to follow a normal distribution with standard deviation:
(Multiple Choice)
4.8/5 (30)
Exhibit 20.12.A magician has a coin that may or not be fair.The results of 30 flips of the coin are: H H T H T H H T H H T H H T H T H H H T T T T T H H H H H T. Refer to Exhibit 20.12.At the 10% significance level,the critical value for the test is
(Multiple Choice)
4.9/5 (37)
Exhibit 20.6.A fund manager wants to know if the annual rate of return is greater for growth stocks (1)than value stocks (2).The fund manager collects data on the returns of growth and value funds.Below are the sample sizes and rank sums for the Wilcoxon rank-sum test.  Refer to Exhibit 20.6.At the 1% significance level,the critical value is:
(Multiple Choice)
4.9/5 (41)
Exhibit 20.11.A wine magazine wants to know if chefs can tell the difference between duck liver pate and wet dog food.Eighteen chefs were asked to rate both the pate and dog food on a scale from 1 to 5,with 1 corresponding to "inedible" and 5 to "very tasty".The results are shown in the following table. 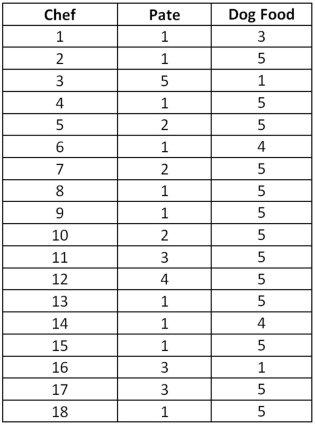 Refer to Exhibit 20.11.Using the p-value approach and
  ,the appropriate conclusion is:
(Multiple Choice)
4.9/5 (44)
An airline claims that the median price of a round-trip ticket is less than $503.For a random sample of 400 tickets,the value of the Wilcoxon sign-ranks test is 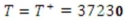 .
A)Specify the competing hypothesis in order to determine whether the median ticket price is less than $503.
B)Assume the normal approximation for the distribution of T,and calculate the value of the corresponding test statistic.
C)At the 10% significance level,what is the decision and conclusion?
.
A)Specify the competing hypothesis in order to determine whether the median ticket price is less than $503.
B)Assume the normal approximation for the distribution of T,and calculate the value of the corresponding test statistic.
C)At the 10% significance level,what is the decision and conclusion?
(Essay)
4.9/5 (38)
Exhibit 20.8.A sports agent wants to understand the differences in the annual earnings of players in different sports.The below table shows the annual earnings (in million dollars)of 52 athletes.For the Kruskal-Wallis test,the rank sums for each group are at the bottom of the table. 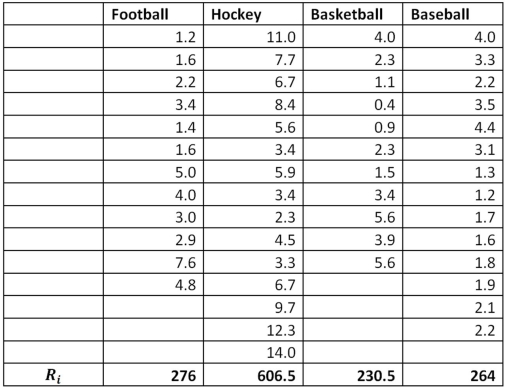 Refer to Exhibit 20.8.Using the critical value approach,the appropriate conclusion is:
(Multiple Choice)
4.9/5 (38)
Exhibit 20.13.An energy analyst wants to test if U.S.oil production is random over time.The analyst has monthly production values for the two years.The analyst finds 12 months are above the median,12 months are below the median,6 runs are below the median,and 5 runs are above the median. Refer to Exhibit 20.13.Using the p-value approach and  ,the appropriate conclusion is:
(Multiple Choice)
4.8/5 (41)
Exhibit 20.1.A pawn shop claims to sell used Kindles for about the same price as Amazon or eBay.Both online retailers sell used Kindles for around $150.Below are recent Kindle sales prices for the pawn shop. 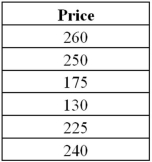 Refer to Exhibit 20.1.What is the value of the test statistic?
(Multiple Choice)
4.8/5 (27)
Exhibit 20.3.A company which produces financial accounting software wants to offer better training to its customers.The training is intended to decrease the amount of time required to do complicated accounting calculations.For seven individuals,the amount of time (in minutes)to complete a complicated calculation is determined before and after completing the new training. 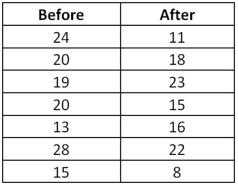 Refer to Exhibit 20.3.The value of the test statistic is:
(Multiple Choice)
4.8/5 (28)
Exhibit 20.6.A fund manager wants to know if the annual rate of return is greater for growth stocks (1)than value stocks (2).The fund manager collects data on the returns of growth and value funds.Below are the sample sizes and rank sums for the Wilcoxon rank-sum test. 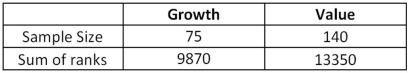 Refer to Exhibit 20.6.The value of W is:
(Multiple Choice)
4.7/5 (41)
Filters
- Essay(0)
- Multiple Choice(0)
- Short Answer(0)
- True False(0)
- Matching(0)