Exam 20: Nonparametric Tests
Exam 1: Statistics and Data68 Questions
Exam 2: Tabular and Graphical Methods99 Questions
Exam 3: Numerical Descriptive Measures123 Questions
Exam 4: Basic Probability Concepts107 Questions
Exam 5: Discrete Probability Distributions118 Questions
Exam 6: Continuous Probability Distributions114 Questions
Exam 7: Sampling and Sampling Distributions110 Questions
Exam 8: Interval Estimation111 Questions
Exam 9: Hypothesis Testing111 Questions
Exam 10: Statistical Inference Concerning Two Populations104 Questions
Exam 11: Statistical Inference Concerning Variance96 Questions
Exam 12: Chi-Square Tests100 Questions
Exam 13: Analysis of Variance89 Questions
Exam 14: Regression Analysis116 Questions
Exam 15: Inference With Regression Models117 Questions
Exam 16: Regression Models for Nonlinear Relationships95 Questions
Exam 17: Regression Models With Dummy Variables117 Questions
Exam 18: Time Series and Forecasting103 Questions
Exam 19: Returns, Index Numbers and Inflation98 Questions
Exam 20: Nonparametric Tests99 Questions
Select questions type
Exhibit 20.13.An energy analyst wants to test if U.S.oil production is random over time.The analyst has monthly production values for the two years.The analyst finds 12 months are above the median,12 months are below the median,6 runs are below the median,and 5 runs are above the median. Refer to Exhibit 20.13.To test the random-walk hypothesis about oil production,the competing hypothesis are:
(Multiple Choice)
4.9/5  (36)
(36)
A real estate agent wants to know how the home size (in square feet)of parents compares to their children.For a sample of seven parents and their children,the value of the test statistic for the Wilcoxon signed-rank test for a matched pairs sample is  .The differences are calculated as the parent's home size subtracted by the child's home size.
A)Specify the competing hypothesis in order to determine if the median difference in home size between parents and children is greater than zero.
B)At the 5% significance level,what is the critical value?
C)At the 5% significance level,what is the decision and conclusion?
.The differences are calculated as the parent's home size subtracted by the child's home size.
A)Specify the competing hypothesis in order to determine if the median difference in home size between parents and children is greater than zero.
B)At the 5% significance level,what is the critical value?
C)At the 5% significance level,what is the decision and conclusion?
(Essay)
4.7/5 (40)
Exhibit 20.12.A magician has a coin that may or not be fair.The results of 30 flips of the coin are: H H T H T H H T H H T H H T H T H H H T T T T T H H H H H T. Refer to Exhibit 20.12.To determine if the coin is fair using the Wald-Wolfowitz runs test,the competing hypotheses are:
(Multiple Choice)
4.7/5 (34)
Exhibit 20.2.A trading magazine wants to determine the number of hours stock brokers work each week.In particular,the trading magazine wants to determine if the median numbers worked per week differs from 100 hours.The magazine samples 18 traders.For the Wilcoxon Signed-Rank Test,the value of the test statistic is  . Refer to Exhibit 20.2.Specify the competing hypotheses in order to determine if the median number of hours worked per week differs from 100 hours.
(Multiple Choice)
4.7/5 (39)
Exhibit 20.12.A magician has a coin that may or not be fair.The results of 30 flips of the coin are: H H T H T H H T H H T H H T H T H H H T T T T T H H H H H T. Refer to Exhibit 20.12.Using the critical value approach,appropriate conclusion is:
(Multiple Choice)
4.9/5 (33)
Exhibit 20.2.A trading magazine wants to determine the number of hours stock brokers work each week.In particular,the trading magazine wants to determine if the median numbers worked per week differs from 100 hours.The magazine samples 18 traders.For the Wilcoxon Signed-Rank Test,the value of the test statistic is  . Refer to Exhibit 20.2.Using the critical value approach,the appropriate conclusion is:
(Multiple Choice)
4.8/5 (42)
Exhibit 20.11.A wine magazine wants to know if chefs can tell the difference between duck liver pate and wet dog food.Eighteen chefs were asked to rate both the pate and dog food on a scale from 1 to 5,with 1 corresponding to "inedible" and 5 to "very tasty".The results are shown in the following table. 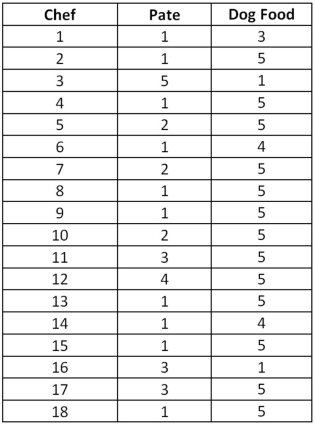 Refer to Exhibit 20.11.The estimate of the population proportion of plus signs is:
(Multiple Choice)
5.0/5 (40)
A career counselor is comparing the annual salary of executives in the manufacturing,finance,and engineering industries.The following table shows the sample size for each industry and the rank sum for the Kruskal-Wallis test. 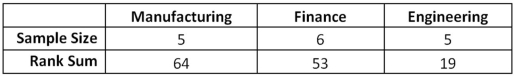 a.Specify the competing hypotheses to determine whether differences exist in the median annual salary of the three industries.
B)What is the value of the Kruskal-Wallis test statistic H?
C)At the 5% significance level,what is the decision and conclusion?
a.Specify the competing hypotheses to determine whether differences exist in the median annual salary of the three industries.
B)What is the value of the Kruskal-Wallis test statistic H?
C)At the 5% significance level,what is the decision and conclusion?
(Essay)
4.8/5 (36)
Exhibit 20.3.A company which produces financial accounting software wants to offer better training to its customers.The training is intended to decrease the amount of time required to do complicated accounting calculations.For seven individuals,the amount of time (in minutes)to complete a complicated calculation is determined before and after completing the new training. 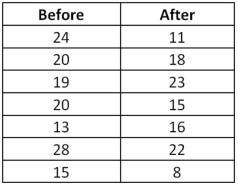 Refer to Exhibit 20.3.At the 5% significance level,the critical value is:
(Multiple Choice)
4.8/5 (42)
The nonparametric test to determine if a sequence is random is:
(Multiple Choice)
4.8/5 (30)
Exhibit 20.2.A trading magazine wants to determine the number of hours stock brokers work each week.In particular,the trading magazine wants to determine if the median numbers worked per week differs from 100 hours.The magazine samples 18 traders.For the Wilcoxon Signed-Rank Test,the value of the test statistic is  . Refer to Exhibit 20.2.At the 1% significance level,the right-tail critical value is:
(Multiple Choice)
4.9/5 (35)
Exhibit 20.3.A company which produces financial accounting software wants to offer better training to its customers.The training is intended to decrease the amount of time required to do complicated accounting calculations.For seven individuals,the amount of time (in minutes)to complete a complicated calculation is determined before and after completing the new training.  Refer to Exhibit 20.3.Using the p-value approach and
  ,the appropriate conclusion is:
(Multiple Choice)
4.7/5 (37)
Exhibit 20.7.A marketing firm needs to replace its existing network provider,and is considering three different providers.A primary consideration is the amount of system down time.The following table contains the amount of network down-time (in hours)for the last five months for each network provider. 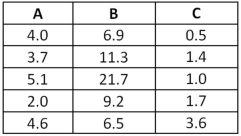 Refer to Exhibit 20.7.At the 5% significance level,the critical value is
(Multiple Choice)
4.8/5 (37)
Exhibit 20.3.A company which produces financial accounting software wants to offer better training to its customers.The training is intended to decrease the amount of time required to do complicated accounting calculations.For seven individuals,the amount of time (in minutes)to complete a complicated calculation is determined before and after completing the new training.  Refer to Exhibit 20.3.The p-value for the test is:
(Multiple Choice)
4.8/5 (30)
Exhibit 20.8.A sports agent wants to understand the differences in the annual earnings of players in different sports.The below table shows the annual earnings (in million dollars)of 52 athletes.For the Kruskal-Wallis test,the rank sums for each group are at the bottom of the table. 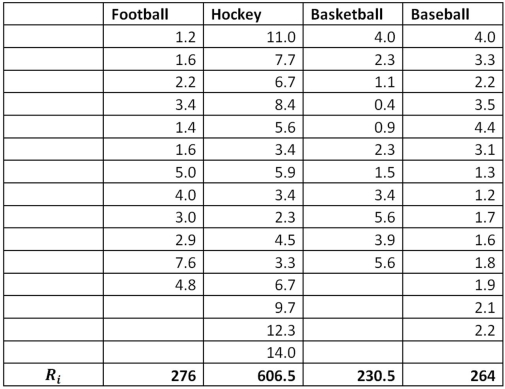 Refer to Exhibit 20.8.The test statistic value is:
(Multiple Choice)
4.8/5 (32)
Exhibit 20.10.SHY (NYSEARCA: SHY)is a 1-3 year Treasury bond fund which is considered to be a market neutral position.Using the S&P 500 as a benchmark and five years of monthly log-return data,the rank correlation coefficient of SHY with the S&P 500 is found to be  . Refer to Exhibit 20.10.Using the p-value approach and
  ,the appropriate conclusion is:
(Multiple Choice)
4.8/5 (38)
Exhibit 20.1.A pawn shop claims to sell used Kindles for about the same price as Amazon or eBay.Both online retailers sell used Kindles for around $150.Below are recent Kindle sales prices for the pawn shop. 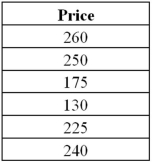 Refer to Exhibit 20.1.At the 5% significance level,the critical value is:
(Multiple Choice)
4.8/5 (33)
If n ≥ 10,the Spearman rank correlation coefficient can be assumed to follow a normal distribution with:
(Multiple Choice)
4.9/5 (46)
Exhibit 20.13.An energy analyst wants to test if U.S.oil production is random over time.The analyst has monthly production values for the two years.The analyst finds 12 months are above the median,12 months are below the median,6 runs are below the median,and 5 runs are above the median. Refer to Exhibit 20.13.Assuming  has the standard normal distribution,the p-value for the test is:
(Multiple Choice)
4.8/5 (33)
Filters
- Essay(0)
- Multiple Choice(0)
- Short Answer(0)
- True False(0)
- Matching(0)