Exam 11: Statistical Inference Concerning Variance
Exam 1: Statistics and Data68 Questions
Exam 2: Tabular and Graphical Methods99 Questions
Exam 3: Numerical Descriptive Measures123 Questions
Exam 4: Basic Probability Concepts107 Questions
Exam 5: Discrete Probability Distributions118 Questions
Exam 6: Continuous Probability Distributions114 Questions
Exam 7: Sampling and Sampling Distributions110 Questions
Exam 8: Interval Estimation111 Questions
Exam 9: Hypothesis Testing111 Questions
Exam 10: Statistical Inference Concerning Two Populations104 Questions
Exam 11: Statistical Inference Concerning Variance96 Questions
Exam 12: Chi-Square Tests100 Questions
Exam 13: Analysis of Variance89 Questions
Exam 14: Regression Analysis116 Questions
Exam 15: Inference With Regression Models117 Questions
Exam 16: Regression Models for Nonlinear Relationships95 Questions
Exam 17: Regression Models With Dummy Variables117 Questions
Exam 18: Time Series and Forecasting103 Questions
Exam 19: Returns, Index Numbers and Inflation98 Questions
Exam 20: Nonparametric Tests99 Questions
Select questions type
Consider the following hypotheses:  Approximate the p-value based on the following sample information,where the sample is drawn from a normally distributed population.
A)s2 = 500;n = 15
B)s2 = 600;n = 10
C)Which of the above sample information enables us to reject the null hypothesis at α = 0.10?
Approximate the p-value based on the following sample information,where the sample is drawn from a normally distributed population.
A)s2 = 500;n = 15
B)s2 = 600;n = 10
C)Which of the above sample information enables us to reject the null hypothesis at α = 0.10?
(Essay)
4.9/5  (28)
(28)
A random sample of 21 pages is used to estimate the population variance of the number of typographical errors in a book.The sample mean and sample standard deviation are calculated as 7.34 and 5.11,respectively.Assume that the population is normally distributed.
A)Construct a 95% interval estimate of the population variance.
B)Construct a 99% interval estimate of the population variance.
C)Use your answers to discuss the impact of the confidence level on the width of the interval.
(Short Answer)
4.9/5 (32)
To estimate the ratio of the population variances of the monthly closing stock prices (in $)of two emerging market funds,following summary measures are obtained using the sample data for 8 months.The two samples are drawn independently from normally distributed populations.
Emerging market fund 1:  = 18.65,
  = 0.47,and n1 = 8
Emerging market fund 2:
= 0.47,and n1 = 8
Emerging market fund 2:  = 17.95,
  = 0.24,and n2 = 8
Construct a 90% interval estimate of the ratio of the population variances.
= 0.24,and n2 = 8
Construct a 90% interval estimate of the ratio of the population variances.
(Short Answer)
4.8/5 (41)
A  distribution tends to the ____,as the degrees of freedom increase.
(Multiple Choice)
4.9/5 (35)
Which of the following is the formula for the sample variance s2 when used as an estimate of σ2 for a random sample of n observations from a population?
(Multiple Choice)
4.8/5 (41)
The degrees of freedom df1 and df2 for an F(df1,df2) distribution is given by _____ and ____.
(Multiple Choice)
4.9/5 (46)
Students of two sections of a History course took a common final examination.The course instructor examines the variance in scores between the two sections.He selects random samples of n1 = 11 and n2 = 16 with sample variances of  and
and  ,respectively.Assuming that the population distributions are normal,construct a 90% confidence interval for the ratio of the population variance.
(Multiple Choice)
4.9/5 (35)
Find the value of x given the equation P(F(6,10) ≥ x)= 0.025.
(Multiple Choice)
4.8/5 (36)
How does the width of the interval respond to the changes in the confidence interval?
(Multiple Choice)
4.7/5 (35)
Exhibit 11-5.Amie Jackson,a manager at Sigma travel services,makes every effort to ensure that customers attempting to make online reservations do not have to wait too long to complete the reservation process.The travel website is open for reservations 24 hours a day,and Amie regularly checks the website for the waiting time to maintain consistency in service.She uses the following independently drawn samples of wait time during two peak hours,morning 8 am to 10 am and evening 7 pm to 9 pm,for the analysis.Assume that wait times are normally distributed. 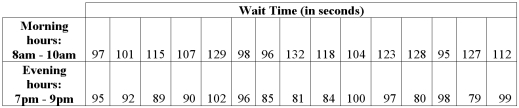 Refer to Exhibit 11-5.Identify the 95% interval estimate for the ratio of the population variances.
(Multiple Choice)
4.9/5 (32)
Consider the following competing hypotheses and relevant summary statistics: 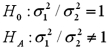 Sample 1:
  = 680,and n1 = 17
Sample 2:
= 680,and n1 = 17
Sample 2:  = 500,and n2 = 16
A)Using the critical value approach,conduct this hypothesis test at the 5% significance level.What are the assumptions?
B)Confirm the conclusions by using the p-value approach.
= 500,and n2 = 16
A)Using the critical value approach,conduct this hypothesis test at the 5% significance level.What are the assumptions?
B)Confirm the conclusions by using the p-value approach.
(Essay)
4.9/5 (27)
The following table shows the annual returns (in percent)for Fidelity's Technology and Communications funds for the years 2006 through 2010. 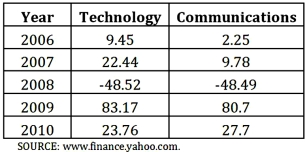 Use the critical value approach to test if the population variances differ at the 10% significance level.State the assumptions.
(Essay)
4.8/5 (36)
We conduct the following hypothesis test:  versus
  .For a random sample of 15 observations,the sample standard deviation is 12.Approximate the p-value used to conduct this test.
(Multiple Choice)
4.9/5 (36)
Exhibit 11-5.Amie Jackson,a manager at Sigma travel services,makes every effort to ensure that customers attempting to make online reservations do not have to wait too long to complete the reservation process.The travel website is open for reservations 24 hours a day,and Amie regularly checks the website for the waiting time to maintain consistency in service.She uses the following independently drawn samples of wait time during two peak hours,morning 8 am to 10 am and evening 7 pm to 9 pm,for the analysis.Assume that wait times are normally distributed.  Refer to Exhibit 11-5.State the null and the alternate hypotheses to determine if the variance of wait time during morning peak hours (population 1)differs from that during the evening peak hours (population 2).
(Multiple Choice)
4.8/5 (42)
For a sample of 10 observations drawn from a normally distributed population,we obtain the sample mean and the sample variance as 50 and 75,respectively.We want to determine whether the population variance is greater than 70.The critical value at a 5% significance level is:
(Multiple Choice)
4.9/5 (43)
The estimator of  used in the inference regarding the ratio of two population variances is
  .
.
(True/False)
5.0/5 (34)
Exhibit 11-2.The manager of a video library would like the variance of the waiting times of the customers not to exceed 2.30 minutes-squared.He would like to add an additional billing counter if the variance exceeds the cut-off.He checks the recent sample data.For a random sample of 24 customer waiting times,he arrives at a sample variance of 3.8 minutes-squared.The manager assumes the waiting times to be normally distributed. Refer to Exhibit 11-2.Which of the following would be null and the alternate hypothesis to test if the cut-off is surpassed?
(Multiple Choice)
4.9/5 (27)
Given below are the values taken from a normal population.  A 95% confidence interval for the population variance is closest to:
(Multiple Choice)
4.8/5 (29)
The sample standard deviation of the monthly sales (in thousands of dollars)of a telecommunications firm in U.S.for two years,2010 and 2011,is computed as 6.7.Assuming that the sales data are drawn from a normally distributed population,conduct the following hypothesis tests for the population variance.Use the critical value approach at α = 0.05.
A) 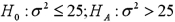 b.
b. 
(Essay)
4.7/5 (40)
Which of the following characteristics is true with regard to the F distribution?
(Multiple Choice)
4.8/5 (30)
Filters
- Essay(0)
- Multiple Choice(0)
- Short Answer(0)
- True False(0)
- Matching(0)