Exam 11: Statistical Inference Concerning Variance
Exam 1: Statistics and Data68 Questions
Exam 2: Tabular and Graphical Methods99 Questions
Exam 3: Numerical Descriptive Measures123 Questions
Exam 4: Basic Probability Concepts107 Questions
Exam 5: Discrete Probability Distributions118 Questions
Exam 6: Continuous Probability Distributions114 Questions
Exam 7: Sampling and Sampling Distributions110 Questions
Exam 8: Interval Estimation111 Questions
Exam 9: Hypothesis Testing111 Questions
Exam 10: Statistical Inference Concerning Two Populations104 Questions
Exam 11: Statistical Inference Concerning Variance96 Questions
Exam 12: Chi-Square Tests100 Questions
Exam 13: Analysis of Variance89 Questions
Exam 14: Regression Analysis116 Questions
Exam 15: Inference With Regression Models117 Questions
Exam 16: Regression Models for Nonlinear Relationships95 Questions
Exam 17: Regression Models With Dummy Variables117 Questions
Exam 18: Time Series and Forecasting103 Questions
Exam 19: Returns, Index Numbers and Inflation98 Questions
Exam 20: Nonparametric Tests99 Questions
Select questions type
Which of the following Excel functions is used to calculate the exact probability for a left-tailed  distribution?
(Multiple Choice)
4.9/5  (33)
(33)
A researcher analyzes the returns for two mutual funds,Smith,Inc.and Campbell,Inc.in order to determine which of the two has a higher risk rate.She assumes that the returns are normally distributed.Implement the critical value approach at a significance level of 10%.The sample descriptive measures are given below.
Smith,Inc.  = 28.46%;s1 = 36.32%;n1 = 12
Campbell,Inc.
= 28.46%;s1 = 36.32%;n1 = 12
Campbell,Inc.  = 9.84%;s2 = 12.43%;n2 = 12
(Essay)
4.8/5 (32)
Identify the hypothesis that depicts a right-tailed test for the population variance from the list of hypotheses given below.
(Multiple Choice)
4.8/5 (35)
Exhibit 11-6.A financial analyst examines the performance of two mutual funds and claims that the variances of the annual returns for the bond funds differ.To support his claim,he collects data on the annual returns (in percent)for the years 2001 through 2010.The analyst assumes that the annual returns for the two emerging market bond funds are normally distributed.Here are some relevant summary statistics. 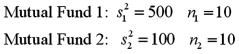 Refer to Exhibit 11-6.At α = 0.10,is the analyst's claim supported by the data using the critical value approach?
(Multiple Choice)
4.8/5 (29)
Exhibit 11-3.The following are the competing hypotheses and the relevant summary statistics. 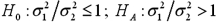 Sample 1:
  n1 = 10 Sample 2:
  n2 = 9
Refer to Exhibit 11-3.The p-value associated with the value of the test statistic is 0.3692.At the 5% significance level,which of the following conclusions is correct?
n2 = 9
Refer to Exhibit 11-3.The p-value associated with the value of the test statistic is 0.3692.At the 5% significance level,which of the following conclusions is correct?
(Multiple Choice)
5.0/5 (36)
The result of placing a larger sample variance in the numerator of the F(df1,df2) statistic allows us to
(Multiple Choice)
4.9/5 (39)
A random sample of 18 observations is taken from a normal population.The sample mean and sample standard deviation are 76.4 and 4.2,respectively.What is an 80% interval estimate of the population variance?
(Multiple Choice)
4.9/5 (30)
Exhibit 11-4.Consider the expected returns (in percent)from the two investment options.Beth claims that the variances of the returns for the two investments differ.Use the following data to arrive at the results.  Refer to Exhibit 11-4.Test Beth's claim at the 5% significance level.What is the conclusion?
(Multiple Choice)
4.9/5 (27)
A two-tailed test is used to determine if two population variances differ.The null hypothesis takes the form H0:
(Multiple Choice)
4.9/5 (31)
Exhibit 11-1.Becky owns a diner and is concerned about sustaining the business.She wants to ascertain if the standard deviation of the profits for each week is greater than $250.The details of the profits for the week are listed below (in dollars. )Assume that profits are normally distributed.  Refer to Exhibit 11-1.What is the value of the test statistic?
(Multiple Choice)
4.9/5 (38)
You want to test whether the population variance differs from 50.From a sample of 25 observations drawn from a normally distributed population,you calculate s2 = 80.When conducting this test at the 5% significance level,the value of test statistic,  is:
is:
(Multiple Choice)
4.7/5 (41)
Exhibit 11-2.The manager of a video library would like the variance of the waiting times of the customers not to exceed 2.30 minutes-squared.He would like to add an additional billing counter if the variance exceeds the cut-off.He checks the recent sample data.For a random sample of 24 customer waiting times,he arrives at a sample variance of 3.8 minutes-squared.The manager assumes the waiting times to be normally distributed. Refer to Exhibit 11-2.At α = 0.05 which of the following is the critical value,  ?
?
(Multiple Choice)
4.9/5 (34)
Two students,Mary and Joanna,in a Statistics class are working hard on the consistency of their performance in the weekly class tests.In particular,they are hoping to bring down the variance of their test scores.Their professor believes that the students are not equally consistent in their tests.Over a 12-week period,the test scores of these two students are shown below.Assume that the two samples are drawn independently from normally distributed populations.  a.Develop the hypotheses to test whether the two students differ in consistency.
B)Use the critical value approach to test the professor's claim at α = 0.05.
a.Develop the hypotheses to test whether the two students differ in consistency.
B)Use the critical value approach to test the professor's claim at α = 0.05.
(Essay)
4.9/5 (35)
Exhibit 11-3.The following are the competing hypotheses and the relevant summary statistics.  Sample 1:
  n1 = 10 Sample 2:
  n2 = 9
Refer to Exhibit 11-3.What is the critical value at the 5% significance level?
n2 = 9
Refer to Exhibit 11-3.What is the critical value at the 5% significance level?
(Multiple Choice)
4.9/5 (37)
The formula for constructing the confidence interval for the ratio of two population variances is based on the assumption that the sample variances are computed from independently drawn samples from two nonnormal populations.
(True/False)
4.8/5 (25)
It is preferable to place the smaller sample variance in the numerator of the  statistic.
(True/False)
4.9/5 (28)
Using the critical value approach,conduct the following hypothesis test at the 1% significance level. 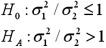 Sample 1:
  = 23.5,
  = 24.23,and n1 = 8
Sample 2:
= 24.23,and n1 = 8
Sample 2:  = 30.8,
  = 10.86,and n2 = 7
Assume that the two populations are normally distributed.
= 10.86,and n2 = 7
Assume that the two populations are normally distributed.
(Essay)
4.7/5 (28)
Exhibit 11-2.The manager of a video library would like the variance of the waiting times of the customers not to exceed 2.30 minutes-squared.He would like to add an additional billing counter if the variance exceeds the cut-off.He checks the recent sample data.For a random sample of 24 customer waiting times,he arrives at a sample variance of 3.8 minutes-squared.The manager assumes the waiting times to be normally distributed. Refer to Exhibit 11-2.Approximate the p-value.
(Multiple Choice)
4.7/5 (36)
The formula for the confidence interval of the population variance σ2 is valid for the random samples drawn from any population.
(True/False)
4.8/5 (34)
Filters
- Essay(0)
- Multiple Choice(0)
- Short Answer(0)
- True False(0)
- Matching(0)