Exam 11: Statistical Inference Concerning Variance
Exam 1: Statistics and Data68 Questions
Exam 2: Tabular and Graphical Methods99 Questions
Exam 3: Numerical Descriptive Measures123 Questions
Exam 4: Basic Probability Concepts107 Questions
Exam 5: Discrete Probability Distributions118 Questions
Exam 6: Continuous Probability Distributions114 Questions
Exam 7: Sampling and Sampling Distributions110 Questions
Exam 8: Interval Estimation111 Questions
Exam 9: Hypothesis Testing111 Questions
Exam 10: Statistical Inference Concerning Two Populations104 Questions
Exam 11: Statistical Inference Concerning Variance96 Questions
Exam 12: Chi-Square Tests100 Questions
Exam 13: Analysis of Variance89 Questions
Exam 14: Regression Analysis116 Questions
Exam 15: Inference With Regression Models117 Questions
Exam 16: Regression Models for Nonlinear Relationships95 Questions
Exam 17: Regression Models With Dummy Variables117 Questions
Exam 18: Time Series and Forecasting103 Questions
Exam 19: Returns, Index Numbers and Inflation98 Questions
Exam 20: Nonparametric Tests99 Questions
Select questions type
Exhibit 11-1.Becky owns a diner and is concerned about sustaining the business.She wants to ascertain if the standard deviation of the profits for each week is greater than $250.The details of the profits for the week are listed below (in dollars. )Assume that profits are normally distributed.  Refer to Exhibit 11-1.The appropriate null and alternate hypotheses are:
(Multiple Choice)
4.8/5  (31)
(31)
The sample mean and the sample standard deviation of annual returns on a stock over a 12-year period as computed by a stock analyst were 18% and 12%,respectively.The analyst wants to know if the risk,as measured by the standard deviation,differs from 15%.
A)Construct a 90% confidence interval of the population variance and the population standard deviation.
B)What assumption is required in constructing the confidence interval?
C)Based on the above confidence interval,does the risk differ from 15%?
(Short Answer)
4.7/5 (32)
The value of the test statistic for the hypothesis test of the population variance,σ2 is computed as 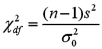 .
.
(True/False)
4.8/5 (31)
The skewness of the Chi-square probability distribution depends on the degrees of freedom.
(True/False)
4.8/5 (39)
The following table shows the heights (in inches)of individuals recorded recently for two families,the Williams' and the Thomas',in Chicago,Illinois: 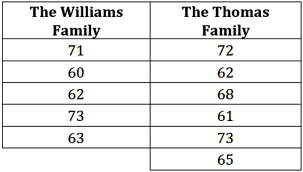 a.Construct a 95% interval estimate of the ratio of the population variances.
B)Using the computed confidence interval,test if the ratio of the population variances differs from one at the 5% significance level.Explain.
a.Construct a 95% interval estimate of the ratio of the population variances.
B)Using the computed confidence interval,test if the ratio of the population variances differs from one at the 5% significance level.Explain.
(Short Answer)
4.9/5 (41)
Statistical inferences regarding σ2 are based on the F distribution.
(True/False)
5.0/5 (37)
The following data,drawn from a normal population,is the waiting time (in minutes)of 12 randomly selected customers at a travel desk.
1.8,2.4,2.7,2.1,1.3,1.7,1.5,1.5,2.3,2.8,2.5,1.9
A)Calculate the point estimates of the population variance and the population standard deviation.
B)Compute a 90% confidence interval for the population variance and the population standard deviation.
(Essay)
4.9/5 (38)
Exhibit 11-5.Amie Jackson,a manager at Sigma travel services,makes every effort to ensure that customers attempting to make online reservations do not have to wait too long to complete the reservation process.The travel website is open for reservations 24 hours a day,and Amie regularly checks the website for the waiting time to maintain consistency in service.She uses the following independently drawn samples of wait time during two peak hours,morning 8 am to 10 am and evening 7 pm to 9 pm,for the analysis.Assume that wait times are normally distributed. 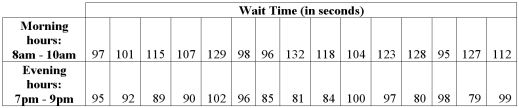 Refer to Exhibit 11-5.Calculate the p-value.
(Multiple Choice)
4.9/5 (36)
Compute a 98% confidence interval for the population variance when the sample variance is 20 for a sample of 10 items from a normal population.
(Multiple Choice)
4.9/5 (30)
Exhibit 11-6.A financial analyst examines the performance of two mutual funds and claims that the variances of the annual returns for the bond funds differ.To support his claim,he collects data on the annual returns (in percent)for the years 2001 through 2010.The analyst assumes that the annual returns for the two emerging market bond funds are normally distributed.Here are some relevant summary statistics. 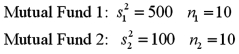 Refer to Exhibit 11-6.Repeat the hypothesis test,
  since
since  .What is the critical F value at the 10% significance level?
(Multiple Choice)
4.8/5 (34)
The following table shows the annual returns (in percent)for the Fidelity Utilities fund from 2006 through 2010. 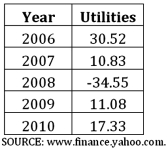 A)Calculate the point estimate of σ.
B)Construct a 95% confidence interval of σ.
A)Calculate the point estimate of σ.
B)Construct a 95% confidence interval of σ.
(Essay)
4.9/5 (36)
Consider the expected returns (in percent)from two investment options.Beth wants to determine if investment 1 has a lower variance.Use the following summary statistics to arrive at the results. Investment 1:  = 33.53;n1 = 8
Investment 2:
= 33.53;n1 = 8
Investment 2:  = 44.76;n2 = 8
Identify the relevant null and alternate hypotheses for this test.
= 44.76;n2 = 8
Identify the relevant null and alternate hypotheses for this test.
(Multiple Choice)
4.9/5 (37)
Find  and
and  under the following scenarios:
A)A 90% confidence level with n = 10.
B)A 95% confidence level with n = 15.
C)A 99% confidence level with n = 20.
under the following scenarios:
A)A 90% confidence level with n = 10.
B)A 95% confidence level with n = 15.
C)A 99% confidence level with n = 20.
(Short Answer)
4.9/5 (36)
Consider the following hypotheses:  A sample variance of 98 is obtained from a random sample of 10 observations drawn from a normally distributed population.At 1% significance level,conduct a test for the population variance using the p-value approach.
(Essay)
4.8/5 (46)
A random sample of 10 homes sold during last month in the city of Fontana had the following number of bedrooms in each house: 4,2,3,5,4,3,3,4,5,3.At α = 0.01,test the claim that the variance of a normally distributed population is less than 1 using (a)the p-value approach and (b)the critical value approach.
(Essay)
4.8/5 (26)
Exhibit 11-1.Becky owns a diner and is concerned about sustaining the business.She wants to ascertain if the standard deviation of the profits for each week is greater than $250.The details of the profits for the week are listed below (in dollars. )Assume that profits are normally distributed.  Refer to Exhibit 11-1.Test Becky's concern using the critical value approach at α = 0.05.What is the result?
(Multiple Choice)
5.0/5 (34)
Filters
- Essay(0)
- Multiple Choice(0)
- Short Answer(0)
- True False(0)
- Matching(0)