Exam 26: Understanding Probability Distributions and Statistical Inference
Exam 2: Data30 Questions
Exam 3: Surveys and Sampling28 Questions
Exam 4: Displaying and Describing Categorical Data32 Questions
Exam 5: Displaying and Describing Quantitative Data32 Questions
Exam 6: Scatterplots, Association, and Correlation32 Questions
Exam 7: Introduction to Linear Regression32 Questions
Exam 8: Randomness and Probability32 Questions
Exam 9: Random Variables and Probability Distributions28 Questions
Exam 10: Sampling Distributions28 Questions
Exam 11: Confidence Intervals for Proportions32 Questions
Exam 12: Testing Hypotheses About Proportions36 Questions
Exam 13: Confidence Intervals and Hypothesis Tests for Means36 Questions
Exam 14: Comparing Two Means32 Questions
Exam 15: Design of Experiments and Analysis of Variance Anova24 Questions
Exam 16: Inference for Counts: Chi-Square Tests26 Questions
Exam 17: Nonparametric Methods26 Questions
Exam 18: Inference for Regression32 Questions
Exam 19: Understanding Regression Residuals28 Questions
Exam 20: Multiple Regression22 Questions
Exam 21: Building Multiple Regression Models22 Questions
Exam 22: Time Series Analysis28 Questions
Exam 23: Decision Making and Risk32 Questions
Exam 24: Quality Control28 Questions
Exam 25: Exploring and Collecting Data32 Questions
Exam 26: Understanding Probability Distributions and Statistical Inference73 Questions
Exam 27: Exploring Relationships Among Variables40 Questions
Exam 28: Using Statistics for Decision Making26 Questions
Select questions type
Use the following to answer the question(s) below.
In economic downturns companies attempt to downsize their workforces by offering early retirement incentives to older employees. A survey of 723 companies found that 195 engage in such downsizing practices.
-The 99% confidence interval for the proportion of companies that downsize their workforces by offering early retirement incentives is
(Multiple Choice)
4.8/5  (35)
(35)
Which of the following is not an assumption or condition that needs to be checked for a two-sample t-test for the difference between two means?
(Multiple Choice)
4.8/5 (34)
Use the following to answer the question(s) below.
Insurance company records indicate that 10% of its policyholders file claims involving theft or robbery of personal property from their homes. Suppose a random sample of 400 policyholders is selected.
-The probability that the sample proportion of policyholders filing claims involving theft or robbery of personal property from their homes is less than 8% is
(Multiple Choice)
4.7/5 (29)
Use the following to answer the question(s) below.
Three brands of AAA batteries are compared to determine if differences in lifetime exist. Each brand is tested in four devices (TV remote, hand-held game, flashlight and digital camera). The experiment is run once for each combination of brand and device. The twelve runs are ordered randomly. The time (in minutes) that each battery lasts under continuous usage is recorded. The partial ANOVA results are as follows: 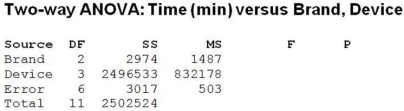 -The P-value associated with this F-statistic associated with the brands is 0.128. Based on this, we can conclude that
(Multiple Choice)
4.8/5 (41)
Use the following to answer the question(s) below.
A men's clothing store has determined the following probability distribution for the number of special size orders placed per month. The distribution is as follows:
Number Ordered Probability
0 0.10
5 0.10
10 0.12
15 0.30
20 0.38
-The number of special size orders this men's clothing store can expect per month is
(Multiple Choice)
4.7/5 (30)
Use the following to answer the question(s) below.
A local politician was interested in determining whether income level affects opinion regarding the governments' bailout bill of the auto industry during the 2008 financial crisis. He surveyed a sample of his constituents and got the following results.
Opinion
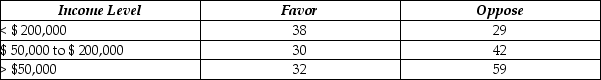 -At the 0.01 level of significance, the correct conclusion is
(Multiple Choice)
4.9/5 (35)
The best tasting ice creams are generally high in fat content, which gives them a creamy texture. Four brands of ice cream (two national and two local) were tested by consumers who graded their level of creaminess (A = very creamy to F = not creamy). Each brand was rated by a different group of consumers (the data are shown below). 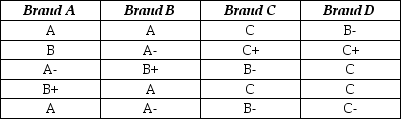 Using the Kruskal-Wallis test, at α = 0.10 we would conclude that
(Multiple Choice)
4.9/5 (38)
Use the following to answer the question(s) below.
Preparing wheat for use in bread and pasta products generally involves both milling and bleaching. A company that processes wheat is interested in determining the best combination of milling and bleaching that results in a desirable wheat product without sacrificing fibre content. They vary the milling time (short, medium and long) and bleaching (no bleaching and bleaching) and measure fibre content (gms/100 grams) of the resulting wheat product. The partial ANOVA results apply. 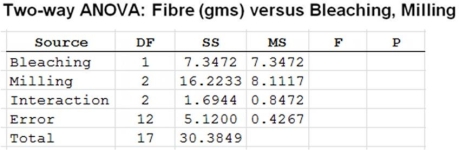 -The P-value associated with the F-statistic for the interaction effect is 0.18. Based on this we can conclude that
(Multiple Choice)
4.9/5 (29)
A quality assurance manager is interested in determining the likelihood that more than 20 calls come in to a particular customer service centre per hour. What method would be most appropriate for assigning this probability?
(Multiple Choice)
4.8/5 (30)
Use the following to answer the question(s) below.
A sample of 30-year fixed mortgage rates at 12 randomly chosen credit unions yields a mean rate of 6.65 % and a sample standard deviation of 0.39%. A sample of 30-year fixed mortgage rates at 16 randomly selected banks yields a mean rate of 7.05% and a sample standard deviation of 0.22%. Are the mean rates different between credit unions and banks? Relevant output is shown below. 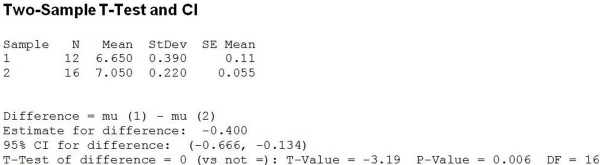 -At the 0.05 level of significance, the correct conclusion is
(Multiple Choice)
4.8/5 (38)
Use the following to answer the question(s) below.
IT staff for a large corporation has developed the following probability distribution for the number of calls requiring troubleshooting problems per day.
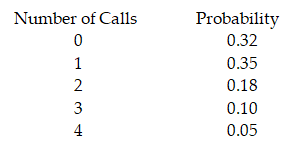 -The expected number of calls per day is
(Multiple Choice)
4.7/5 (44)
Suppose that a manufacturer is testing one of its machines to make sure that the machine is producing more than 97% good parts (H0: p = 0.97 and HA: p > 0.97). The test results in a P-value of 0.102. In reality, the machine is producing 99% good parts. What probably happens as a result of our testing?
(Multiple Choice)
4.9/5 (34)
Use the following to answer the question(s) below.
A newspaper poll asked respondents if they trusted "eco friendly" labels on cleaning products. Out of 1000 adults surveyed, 498 responded "yes." We would like to test if the proportion of respondents that trust these labels is at least 50%.
-The calculated test statistic value is
(Multiple Choice)
4.8/5 (40)
Use the following to answer the question(s) below.
A manufacturer of cordless electric shavers sampled 13 from a day's production and found the mean time of continuous usage without recharging to be 410 minutes with a sample standard deviation of 30 minutes. We can assume that times are normally distributed. We wish to test if the true mean operating time without recharging is more than 400 minutes.
-The correct value of the test statistic is
(Multiple Choice)
5.0/5 (35)
Use the following to answer the question(s) below.
A publishing company conducted a survey of its readership and found that 60% subscribed to Food & Wine, 30% subscribed to Wine Spectator, and 25% subscribed to both.
-The probability that a reader does not subscribe to either is
(Multiple Choice)
4.8/5 (36)
Use the following to answer the question(s) below.
A manufacturer of cordless electric shavers sampled 13 from a day's production and found the mean time of continuous usage without recharging to be 410 minutes with a sample standard deviation of 30 minutes. We can assume that times are normally distributed. We wish to test if the true mean operating time without recharging is more than 400 minutes.
-The correct null and alternative hypotheses are
(Multiple Choice)
4.7/5 (31)
Use the following to answer the question(s) below.
A government agency has 6000 employees. As an alternative to the traditional five day work week, employees were asked whether they preferred a four-day work week (10 hours per day) or flexible hours. The table below shows the results by age category.
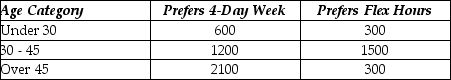 -Two events F = {a randomly selected employee prefers flex hours} and O = {a randomly selected employee is over 45 years old} are
(Multiple Choice)
4.9/5 (28)
A human resources manager at a large company wants to estimate the proportion of employees that would be interested in reimbursement for college courses. If she wishes to be 95% confident that her estimate is within 5% of the true proportion, how many employees would need to be sampled?
(Multiple Choice)
5.0/5 (34)
Filters
- Essay(0)
- Multiple Choice(0)
- Short Answer(0)
- True False(0)
- Matching(0)