Exam 14: Functions of Several Variables and Partial Differentiation
Exam 1: Preliminaries101 Questions
Exam 2: Limits and Continuity105 Questions
Exam 3: Differentiation116 Questions
Exam 4: Applications of the Derivative118 Questions
Exam 5: Integration129 Questions
Exam 6: Applications of the Definite Integral85 Questions
Exam 7: Exponentials, Logarithms and Other Transcendental Functions66 Questions
Exam 8: Integration Techniques123 Questions
Exam 9: First-Order Differential Equations72 Questions
Exam 10: Infinite Series111 Questions
Exam 11: Parametric Equations and Polar Coordinates129 Questions
Exam 12: Vectors and the Geometry of Space107 Questions
Exam 13: Vector-Valued Functions103 Questions
Exam 14: Functions of Several Variables and Partial Differentiation112 Questions
Exam 15: Multiple Integrals92 Questions
Exam 16: Vector Calculus67 Questions
Exam 17: Second Order Differential Equations38 Questions
Select questions type
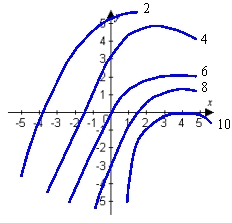
Use the given contour plot to estimate the linear approximation of  at
at  .
. 
(Multiple Choice)
4.9/5  (34)
(34)
Compute the linear approximation of the function at the given point. 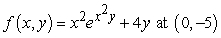
(Multiple Choice)
4.8/5 (35)
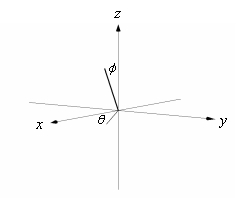
Use a graphing utility to sketch the graph of  . Use the viewpoint
  and
and  (see figure).
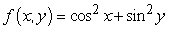
(Multiple Choice)
4.8/5 (36)
A box is to be constructed out of 16 square feet of material. Suppose the bottom of the box must be reinforced by doubling up the material (essentially, there are two bottoms of the box). Find the dimensions l, w, and h that maximizes the volume of the box.
(Multiple Choice)
5.0/5 (35)
Use the chain rule to find the indicated derivative.  , where
(Multiple Choice)
4.8/5 (41)
Find an equation of the tangent plane to the parametric surface at the indicated point. S is defined by 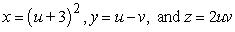 ; at u = -4 and v = -1
(Multiple Choice)
4.8/5 (29)
Use the given contour plot to estimate the linear approximation of  at
at  . Assume each contour line represents a 1 unit increase from left to right with the left-most contour line corresponding to a value of 1.
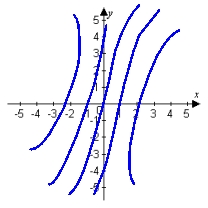
(Multiple Choice)
4.7/5 (39)
Determine all points at which the given function is continuous. 
(Multiple Choice)
4.8/5 (30)
Filters
- Essay(0)
- Multiple Choice(0)
- Short Answer(0)
- True False(0)
- Matching(0)