Exam 13: Queuing Theory
Exam 1: Introduction to Modeling and Decision Analysis78 Questions
Exam 2: Introduction to Optimization and Linear Programming76 Questions
Exam 3: Modeling and Solving Lp Problems in a Spreadsheet93 Questions
Exam 4: Sensitivity Analysis and the Simplex Method76 Questions
Exam 5: Network Modeling92 Questions
Exam 6: Integer Linear Programming102 Questions
Exam 7: Goal Programming and Multiple Objective Optimization81 Questions
Exam 8: Nonlinear Programming Evolutionary Optimization87 Questions
Exam 9: Regression Analysis93 Questions
Exam 10: Data Mining125 Questions
Exam 11: Time Series Forecasting125 Questions
Exam 12: Introduction to Simulation Using Analytic Solver Platform85 Questions
Exam 13: Queuing Theory97 Questions
Exam 14: Decision Analysis125 Questions
Exam 15: Project Management Online82 Questions
Select questions type
Exhibit 13.1
The following questions are based on the output below.
A store currently operates its service system with 1 operator. Arrivals follow a Poisson distribution and service times are exponentially distributed. The following spreadsheet has been developed for the system. 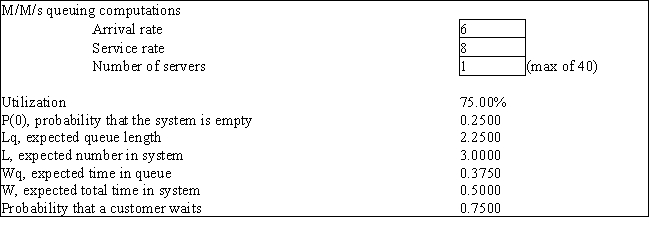 -Which type of queuing system are you likely to encounter at a grocery store?
(Multiple Choice)
4.9/5  (40)
(40)
Exhibit 13.5
The following questions refer to the information and output below.
A computer printer in a large administrative office has a printer buffer (memory to store printing jobs) capacity of 3 jobs. If the buffer is full when a user wants to print a file the user is told that the job cannot be printed and to try again later. There are so many users in this office that we can assume that there is an infinite calling population. Jobs arrive at the printer at a Poisson rate of 55 jobs per hour and take an average of 1 minute to print. Printing times are exponentially distributed. The following queuing analysis spreadsheet was developed from this information. 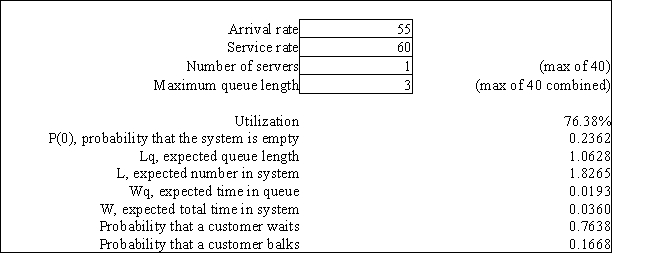 -Refer to Exhibit 13.5. Based on this report how long does a computer user have to wait for his/her job to be completed?
(Short Answer)
4.8/5 (41)
Exhibit 13.2
The following questions refer to the information and output below.
A barber shop has one barber who can give 12 haircuts per hour. Customers arrive at a rate of 8 customers per hour. Customer inter-arrival times and service times are exponentially distributed. The following queuing analysis spreadsheet was developed from this information. 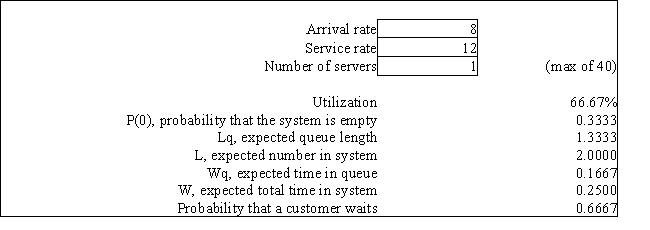 -Customers arrive at a store randomly, following a Poisson distribution at an average rate of 90 per hour. How many customers arrive per minute, on average?
(Short Answer)
4.8/5 (34)
Exhibit 13.7
The following questions refer to the information and output below.
A tax accountant has found that the time to serve a customer has a mean of 30 minutes (or 0.5 hours) and a standard deviation of 6 minutes (or 0.1 hours). Customer arrivals follow a Poisson distribution with an average of 60 minutes between arrivals. The following queuing analysis spreadsheet was developed from this information. 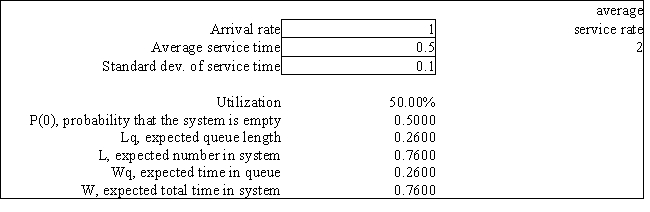 -Refer to Exhibit 13.7. Based on this report how long does a customer spend at the tax accountant's office?
(Short Answer)
4.9/5 (34)
Exhibit 12.5
The following questions use the information below.
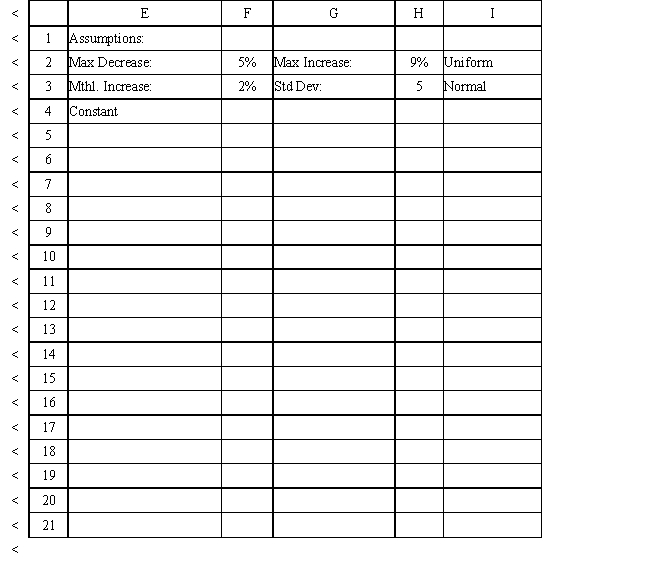
The owner of Sal's Italian Restaurant wants to study the growth of his business using simulation. He is interested in simulating the number of customers and the amount ordered by customers each month. He currently serves 1000 customers per month and feels this can vary uniformly between a decrease of as much as 5% and an increase of up to 9%. The bill for each customer is a normally distributed random variable with a mean of $20 and a standard deviation of $5. The average order has been increasing steadily over the years and the owner expects the mean order will increase by 2% per month. You have created the following spreadsheet to simulate the problem. 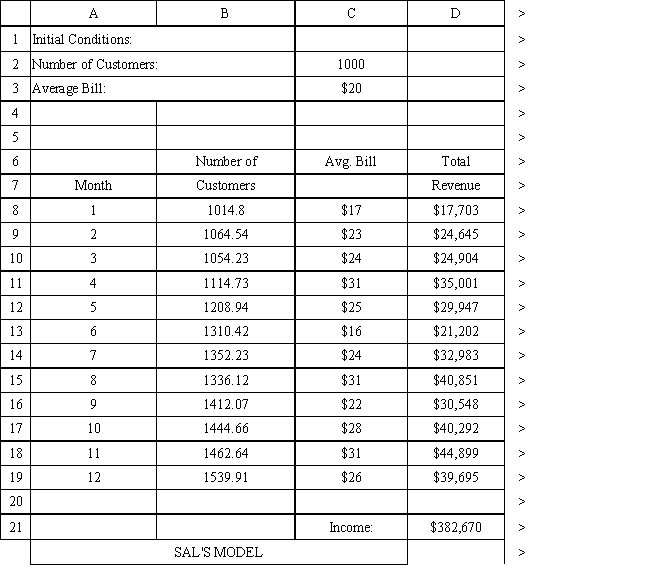
 -A Poisson distribution shape can be described as
(Multiple Choice)
4.8/5 (41)
Exhibit 12.5
The following questions use the information below.
The owner of Sal's Italian Restaurant wants to study the growth of his business using simulation. He is interested in simulating the number of customers and the amount ordered by customers each month. He currently serves 1000 customers per month and feels this can vary uniformly between a decrease of as much as 5% and an increase of up to 9%. The bill for each customer is a normally distributed random variable with a mean of $20 and a standard deviation of $5. The average order has been increasing steadily over the years and the owner expects the mean order will increase by 2% per month. You have created the following spreadsheet to simulate the problem.
-The number of arrivals that occurs in a given time period represents a random variable in a queuing system.
(True/False)
4.8/5 (30)
Exhibit 13.2
The following questions refer to the information and output below.
A barber shop has one barber who can give 12 haircuts per hour. Customers arrive at a rate of 8 customers per hour. Customer inter-arrival times and service times are exponentially distributed. The following queuing analysis spreadsheet was developed from this information.  -Refer to Exhibit 13.2. Based on this report what is the average total time spent waiting for a haircut and getting a haircut?
(Short Answer)
4.9/5 (27)
Exhibit 13.1
The following questions are based on the output below.
A store currently operates its service system with 1 operator. Arrivals follow a Poisson distribution and service times are exponentially distributed. The following spreadsheet has been developed for the system.  -The M/M/s model with finite population can be used to model
(Multiple Choice)
4.7/5 (43)
Exhibit 13.1
The following questions are based on the output below.
A store currently operates its service system with 1 operator. Arrivals follow a Poisson distribution and service times are exponentially distributed. The following spreadsheet has been developed for the system.
-Refer to Exhibit 13.1. What is the average amount of time spent waiting in line?
(Multiple Choice)
4.8/5 (43)
Exhibit 12.5
The following questions use the information below.
The owner of Sal's Italian Restaurant wants to study the growth of his business using simulation. He is interested in simulating the number of customers and the amount ordered by customers each month. He currently serves 1000 customers per month and feels this can vary uniformly between a decrease of as much as 5% and an increase of up to 9%. The bill for each customer is a normally distributed random variable with a mean of $20 and a standard deviation of $5. The average order has been increasing steadily over the years and the owner expects the mean order will increase by 2% per month. You have created the following spreadsheet to simulate the problem.
-What is the service policy in the queuing systems presented in this chapter that is considered "fair" by the customers?
(Multiple Choice)
4.8/5 (44)
Exhibit 13.1
The following questions are based on the output below.
A store currently operates its service system with 1 operator. Arrivals follow a Poisson distribution and service times are exponentially distributed. The following spreadsheet has been developed for the system.
-Joe's Copy Center has 10 copiers. They break down at a rate of 0.02 copiers per hour and are sent to the service facility. What is the average arrival rate of broken copiers to the service facility?
(Multiple Choice)
4.8/5 (31)
Exhibit 12.5
The following questions use the information below.
The owner of Sal's Italian Restaurant wants to study the growth of his business using simulation. He is interested in simulating the number of customers and the amount ordered by customers each month. He currently serves 1000 customers per month and feels this can vary uniformly between a decrease of as much as 5% and an increase of up to 9%. The bill for each customer is a normally distributed random variable with a mean of $20 and a standard deviation of $5. The average order has been increasing steadily over the years and the owner expects the mean order will increase by 2% per month. You have created the following spreadsheet to simulate the problem.
-In the Kendall notation M/D/4, D stands for
(Multiple Choice)
4.8/5 (29)
Exhibit 13.1
The following questions are based on the output below.
A store currently operates its service system with 1 operator. Arrivals follow a Poisson distribution and service times are exponentially distributed. The following spreadsheet has been developed for the system.
-Which type of queuing system are you likely to encounter at a Wendy's restaurant?
(Multiple Choice)
4.7/5 (34)
Exhibit 12.5
The following questions use the information below.
The owner of Sal's Italian Restaurant wants to study the growth of his business using simulation. He is interested in simulating the number of customers and the amount ordered by customers each month. He currently serves 1000 customers per month and feels this can vary uniformly between a decrease of as much as 5% and an increase of up to 9%. The bill for each customer is a normally distributed random variable with a mean of $20 and a standard deviation of $5. The average order has been increasing steadily over the years and the owner expects the mean order will increase by 2% per month. You have created the following spreadsheet to simulate the problem.
-The term queuing theory refers to the body of knowledge dealing with waiting lines.
(True/False)
4.7/5 (32)
Exhibit 12.5
The following questions use the information below.
The owner of Sal's Italian Restaurant wants to study the growth of his business using simulation. He is interested in simulating the number of customers and the amount ordered by customers each month. He currently serves 1000 customers per month and feels this can vary uniformly between a decrease of as much as 5% and an increase of up to 9%. The bill for each customer is a normally distributed random variable with a mean of $20 and a standard deviation of $5. The average order has been increasing steadily over the years and the owner expects the mean order will increase by 2% per month. You have created the following spreadsheet to simulate the problem.
-For a Poisson random variable, λ represents the ____ number of arrivals per time period
(Multiple Choice)
4.9/5 (28)
Exhibit 13.1
The following questions are based on the output below.
A store currently operates its service system with 1 operator. Arrivals follow a Poisson distribution and service times are exponentially distributed. The following spreadsheet has been developed for the system.
-In the Kendall notation M/G/4, M stands for
(Multiple Choice)
4.8/5 (35)
Exhibit 12.5
The following questions use the information below.
The owner of Sal's Italian Restaurant wants to study the growth of his business using simulation. He is interested in simulating the number of customers and the amount ordered by customers each month. He currently serves 1000 customers per month and feels this can vary uniformly between a decrease of as much as 5% and an increase of up to 9%. The bill for each customer is a normally distributed random variable with a mean of $20 and a standard deviation of $5. The average order has been increasing steadily over the years and the owner expects the mean order will increase by 2% per month. You have created the following spreadsheet to simulate the problem.
-One reason to use queuing models in business is
(Multiple Choice)
4.8/5 (34)
Exhibit 13.3
The following questions refer to the information below.
A company has recorded the following customer inter-arrival times and service times for 10 customers at one of its single teller service lines. Assume the data are exponentially distributed and the 10 data points represent a reasonable sample. 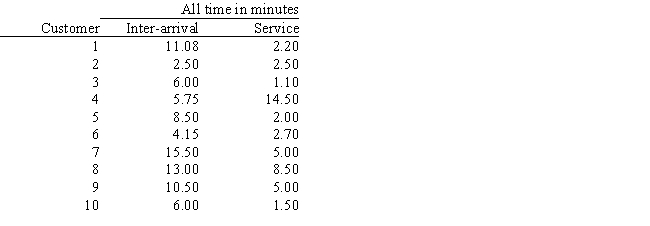 -Refer to Exhibit 13.3. What is the mean arrival rate per hour?
(Essay)
4.8/5 (38)
What is the mean arrival rate based on the following 10 arrival rate observations? 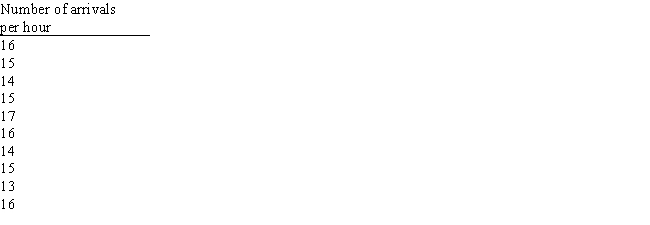
(Short Answer)
4.8/5 (43)
Exhibit 12.5
The following questions use the information below.
The owner of Sal's Italian Restaurant wants to study the growth of his business using simulation. He is interested in simulating the number of customers and the amount ordered by customers each month. He currently serves 1000 customers per month and feels this can vary uniformly between a decrease of as much as 5% and an increase of up to 9%. The bill for each customer is a normally distributed random variable with a mean of $20 and a standard deviation of $5. The average order has been increasing steadily over the years and the owner expects the mean order will increase by 2% per month. You have created the following spreadsheet to simulate the problem.
-What is the formula for P(t ≤ T) under the exponential distribution with rate μ?
(Multiple Choice)
4.9/5 (34)
Filters
- Essay(0)
- Multiple Choice(0)
- Short Answer(0)
- True False(0)
- Matching(0)