Exam 13: Queuing Theory
Exam 1: Introduction to Modeling and Decision Analysis78 Questions
Exam 2: Introduction to Optimization and Linear Programming76 Questions
Exam 3: Modeling and Solving Lp Problems in a Spreadsheet93 Questions
Exam 4: Sensitivity Analysis and the Simplex Method76 Questions
Exam 5: Network Modeling92 Questions
Exam 6: Integer Linear Programming102 Questions
Exam 7: Goal Programming and Multiple Objective Optimization81 Questions
Exam 8: Nonlinear Programming Evolutionary Optimization87 Questions
Exam 9: Regression Analysis93 Questions
Exam 10: Data Mining125 Questions
Exam 11: Time Series Forecasting125 Questions
Exam 12: Introduction to Simulation Using Analytic Solver Platform85 Questions
Exam 13: Queuing Theory97 Questions
Exam 14: Decision Analysis125 Questions
Exam 15: Project Management Online82 Questions
Select questions type
Exhibit 13.4
The following questions refer to the information and output below.
A grocery store can serve an average of 360 customers per hour. The service times are exponentially distributed. The store has 4 checkout lines each of which serves 90 customers per hour. Customers arrive at the store at a Poisson rate of 240 customers per hour. The following queuing analysis spreadsheet was developed from this information. 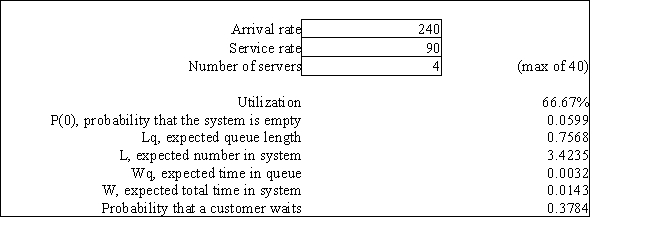 -Refer to Exhibit 13.4. Based on this report how long does a customer wait before the checker begins serving them?
(Short Answer)
4.8/5  (43)
(43)
Exhibit 13.1
The following questions are based on the output below.
A store currently operates its service system with 1 operator. Arrivals follow a Poisson distribution and service times are exponentially distributed. The following spreadsheet has been developed for the system. 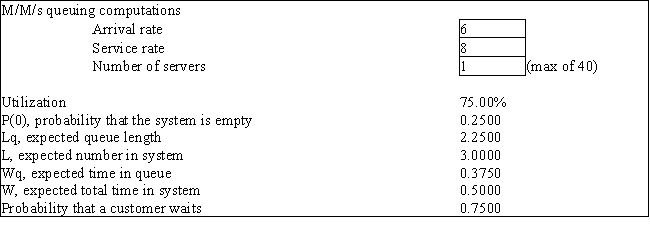 -The M/D/1 model results can be derived from which of the following systems?
(Multiple Choice)
4.9/5 (30)
Exhibit 13.1
The following questions are based on the output below.
A store currently operates its service system with 1 operator. Arrivals follow a Poisson distribution and service times are exponentially distributed. The following spreadsheet has been developed for the system.  -Refer to Exhibit 13.1. How many customers will be in the store on average at any one time?
(Multiple Choice)
4.9/5 (40)
Exhibit 12.5
The following questions use the information below.
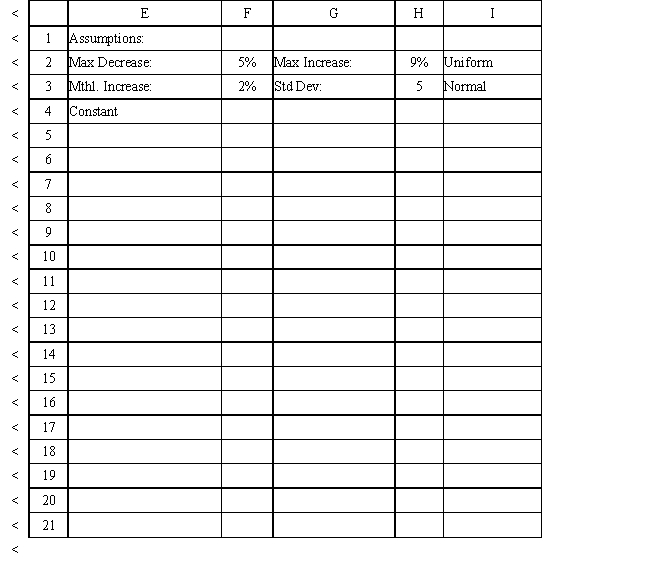
The owner of Sal's Italian Restaurant wants to study the growth of his business using simulation. He is interested in simulating the number of customers and the amount ordered by customers each month. He currently serves 1000 customers per month and feels this can vary uniformly between a decrease of as much as 5% and an increase of up to 9%. The bill for each customer is a normally distributed random variable with a mean of $20 and a standard deviation of $5. The average order has been increasing steadily over the years and the owner expects the mean order will increase by 2% per month. You have created the following spreadsheet to simulate the problem. 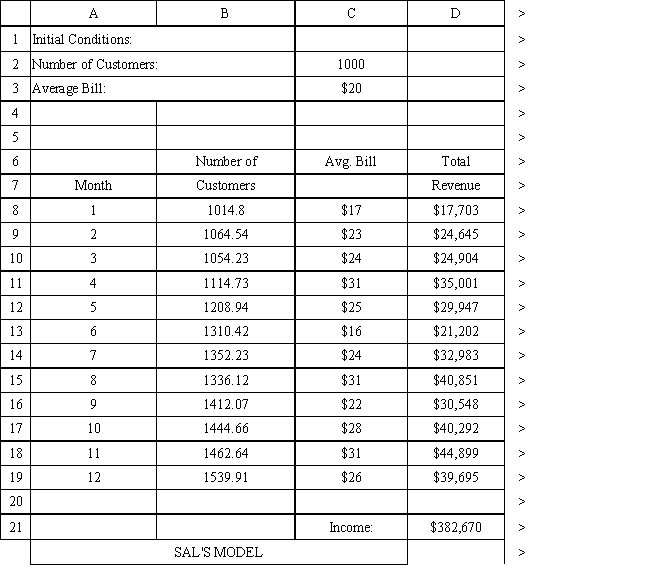
 -The standardized queuing system notation such as M/M/1 or M/G/2 is referred to as
(Multiple Choice)
4.9/5 (37)
Exhibit 13.4
The following questions refer to the information and output below.
A grocery store can serve an average of 360 customers per hour. The service times are exponentially distributed. The store has 4 checkout lines each of which serves 90 customers per hour. Customers arrive at the store at a Poisson rate of 240 customers per hour. The following queuing analysis spreadsheet was developed from this information.  -Refer to Exhibit 13.4. Based on this report what is the average total time spent in line and being checked out?
(Short Answer)
4.8/5 (37)
Exhibit 13.4
The following questions refer to the information and output below.
A grocery store can serve an average of 360 customers per hour. The service times are exponentially distributed. The store has 4 checkout lines each of which serves 90 customers per hour. Customers arrive at the store at a Poisson rate of 240 customers per hour. The following queuing analysis spreadsheet was developed from this information.  -Refer to Exhibit 13.4. What is the Kendall notation for this system?
(Short Answer)
4.9/5 (42)
Exhibit 13.2
The following questions refer to the information and output below.
A barber shop has one barber who can give 12 haircuts per hour. Customers arrive at a rate of 8 customers per hour. Customer inter-arrival times and service times are exponentially distributed. The following queuing analysis spreadsheet was developed from this information.  -Refer to Exhibit 13.2. What is the Kendall notation for this system?
(Short Answer)
4.8/5 (41)
Exhibit 13.1
The following questions are based on the output below.
A store currently operates its service system with 1 operator. Arrivals follow a Poisson distribution and service times are exponentially distributed. The following spreadsheet has been developed for the system.
-The M/D/1 model with infinite capacity queue can be used to model
(Multiple Choice)
5.0/5 (40)
Exhibit 13.1
The following questions are based on the output below.
A store currently operates its service system with 1 operator. Arrivals follow a Poisson distribution and service times are exponentially distributed. The following spreadsheet has been developed for the system.  -Which of the following is the typical operating characteristic for average time a unit spends waiting for service?
(Multiple Choice)
4.9/5 (37)
Exhibit 13.1
The following questions are based on the output below.
A store currently operates its service system with 1 operator. Arrivals follow a Poisson distribution and service times are exponentially distributed. The following spreadsheet has been developed for the system.
-A renege refers to
(Multiple Choice)
4.7/5 (45)
The customer service desk at Joe's Discount Electronics store receives 5 customers per hour on average. On average, each customer requires 10 minutes for service. The customer service desk is staffed by a single person. What is the average number of customers in the customer service area, if modeled as an M/M/1 queuing system?
(Essay)
4.9/5 (43)
Exhibit 13.2
The following questions refer to the information and output below.
A barber shop has one barber who can give 12 haircuts per hour. Customers arrive at a rate of 8 customers per hour. Customer inter-arrival times and service times are exponentially distributed. The following queuing analysis spreadsheet was developed from this information. 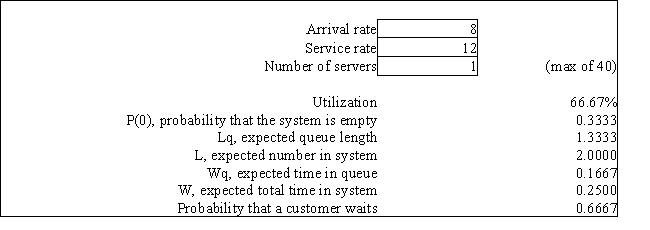 -Refer to Exhibit 13.2. Based on this report what is the average number of customers waiting for a haircut?
(Short Answer)
4.8/5 (36)
Exhibit 13.6
The following questions refer to the information and output below.
The university computer lab has 10 computers which are constantly being used by students. Users need help from the one lab assistant fairly often. Students ask for help at a Poisson rate of with an average of 4 requests per hour for any one computer. The assistant answers questions as quickly as possible and the service time follows an exponential distribution with mean of 1 minute per help session. The following queuing analysis spreadsheet was developed from this information. 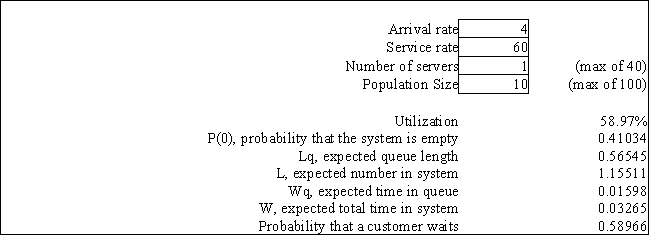 -Refer to Exhibit 13.6. Based on this report what is the average number of students waiting to be helped?
(Short Answer)
4.7/5 (33)
Exhibit 13.1
The following questions are based on the output below.
A store currently operates its service system with 1 operator. Arrivals follow a Poisson distribution and service times are exponentially distributed. The following spreadsheet has been developed for the system.
-The Kendall notation for a queuing system with Poisson arrivals, exponential service and 3 service providers is
(Multiple Choice)
5.0/5 (30)
Exhibit 13.3
The following questions refer to the information below.
A company has recorded the following customer inter-arrival times and service times for 10 customers at one of its single teller service lines. Assume the data are exponentially distributed and the 10 data points represent a reasonable sample. 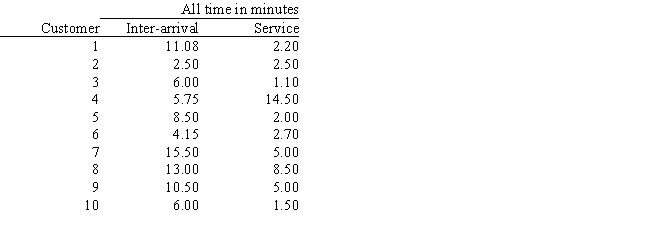 -Refer to Exhibit 13.3. What is the average time a customer spends in the system?
(Essay)
4.9/5 (26)
Exhibit 12.5
The following questions use the information below.
The owner of Sal's Italian Restaurant wants to study the growth of his business using simulation. He is interested in simulating the number of customers and the amount ordered by customers each month. He currently serves 1000 customers per month and feels this can vary uniformly between a decrease of as much as 5% and an increase of up to 9%. The bill for each customer is a normally distributed random variable with a mean of $20 and a standard deviation of $5. The average order has been increasing steadily over the years and the owner expects the mean order will increase by 2% per month. You have created the following spreadsheet to simulate the problem.
-If the number of arrivals in a given period of time follows a Poisson distribution with mean  , the interarrival times follow an exponential probability distribution with mean 1/λ
(True/False)
4.9/5 (42)
Exhibit 13.4
The following questions refer to the information and output below.
A grocery store can serve an average of 360 customers per hour. The service times are exponentially distributed. The store has 4 checkout lines each of which serves 90 customers per hour. Customers arrive at the store at a Poisson rate of 240 customers per hour. The following queuing analysis spreadsheet was developed from this information.  -Refer to Exhibit 13.4. Based on this report what percent of the time is a grocery clerk busy serving a customer?
(Short Answer)
4.9/5 (26)
Filters
- Essay(0)
- Multiple Choice(0)
- Short Answer(0)
- True False(0)
- Matching(0)