Exam 21: Multilevel Linear Models
Exam 1: Why Is My Evil Lecturer Forcing Me to Learn Statistics9 Questions
Exam 2: The Spine of Statistics25 Questions
Exam 3: The Phoenix of Statistics16 Questions
Exam 4: The Ibm Spss Statistics Environment25 Questions
Exam 5: Exploring Data With Graphs12 Questions
Exam 6: The Beast of Bias23 Questions
Exam 7: Non-Parametric Models20 Questions
Exam 8: Correlation23 Questions
Exam 9: The Linear Model Regression20 Questions
Exam 10: Comparing Two Means25 Questions
Exam 11: Moderation, Mediation and Multicategory Predictors16 Questions
Exam 12: Glm 1: Comparing Several Independent Means22 Questions
Exam 13: Glm 2: Comparing Means Adjusted for Other Predictors Analysis of Covariance25 Questions
Exam 14: Glm 3: Factorial Designs25 Questions
Exam 15: Glm 4: Repeated-Measures Designs24 Questions
Exam 16: Glm 5: Mixed Designs17 Questions
Exam 17: Multivariate Analysis of Variance Manova19 Questions
Exam 18: Exploratory Factor Analysis22 Questions
Exam 19: Categorical Outcomes: Chi-Square and Loglinear Analysis24 Questions
Exam 20: Categorical Outcomes: Logistic Regression24 Questions
Exam 21: Multilevel Linear Models9 Questions
Select questions type
What effect does 'centering' have on the data in the following experiment In their study of 'Using individual growth model to analyse the change in quality of life from adolescence to adulthood' (2006), Chen and Cohen conducted interviews on 3 different occasions over a period of time and the following graph demonstrates the physical health changes noted over these 3 periods in 20 of their sample.
 Individual Physical Health Change (raw data, n = 20)
Chen and Cohen Health and Quality of Life Outcomes 2006 4:10 doi:10.1186/1477-7525-4-10
Individual Physical Health Change (raw data, n = 20)
Chen and Cohen Health and Quality of Life Outcomes 2006 4:10 doi:10.1186/1477-7525-4-10
Free
(Multiple Choice)
4.9/5  (38)
(38)
Correct Answer: Verified
B
Which of the following is not an example of the benefits of multilevel models?
Free
(Multiple Choice)
4.7/5 (36)
Correct Answer:Verified
D
In their study of 'Using individual growth model to analyse the change in quality of life from adolescence to adulthood', Chen and Cohen (2006) conducted interviews on three different occasions over a period of time, and the following graph demonstrates the physical health changes noted over these three periods in 20 of their sample. 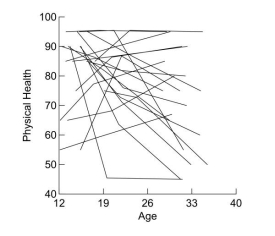 Individual Physical Health Change (raw data, n = 20)
What does the graph illustrate?
Individual Physical Health Change (raw data, n = 20)
What does the graph illustrate?
Free
(Multiple Choice)
4.8/5 (25)
Correct Answer:Verified
C
In a study of the analysis of large hierarchical data with multilevel logistic modelling using PROC Glimmix, Li et al. determine the following results in their first approach to the analysis when considering factors associated with death from injury and exposure, gender, race or age  What would you consider to be the findings of this result?
(Multiple Choice)
4.9/5 (29)
Which of the following was not a good predictor of physical health in this example? In their study of 'Using individual growth model to analyse the change in quality of life from adolescence to adulthood' (2006), Chen and Cohen conducted interviews on 3 different occasions over a period of time and the following graph demonstrates the physical health changes noted over these 3 periods in 20 of their sample.
 Individual Physical Health Change (raw data, n = 20)
Chen and Cohen Health and Quality of Life Outcomes 2006 4:10 doi:10.1186/1477-7525-4-10
The following results are obtained from fitting the unconditional linear growth model.
Table 1
Individual Physical Health Change (raw data, n = 20)
Chen and Cohen Health and Quality of Life Outcomes 2006 4:10 doi:10.1186/1477-7525-4-10
The following results are obtained from fitting the unconditional linear growth model.
Table 1

(Multiple Choice)
4.8/5 (39)
In a study of the Analysis of Large Hierarchical Data with Multilevel Logistic modelling using PROC Glimmix, Li et al determine the following results in their first approach to the analysis when considering factors associated with death from injury and exposure, gender, race or age  In their second round of analysis, a range of data outputs were achieved including the following table
 What do the data represent?
(Multiple Choice)
4.7/5 (28)
What does the Estimates of Covariance Parameters table tell you about the data? 
(Multiple Choice)
4.7/5 (40)
At age 23, what was the average physical health score of the young adults?
(Multiple Choice)
4.9/5 (37)
In their study of 'Using individual growth model to analyse the change in quality of life from adolescence to adulthood' (2006), Chen and Cohen conducted interviews on 3 different occasions over a period of time and the following graph demonstrates the physical health changes noted over these 3 periods in 20 of their sample.  Individual Physical Health Change (raw data, n = 20)
Chen and Cohen Health and Quality of Life Outcomes 2006 4:10 doi:10.1186/1477-7525-4-10
With reference to the graph, what can be deduced about the majority of those sampled?
Individual Physical Health Change (raw data, n = 20)
Chen and Cohen Health and Quality of Life Outcomes 2006 4:10 doi:10.1186/1477-7525-4-10
With reference to the graph, what can be deduced about the majority of those sampled?
(Multiple Choice)
5.0/5 (31)
Filters
- Essay(0)
- Multiple Choice(0)
- Short Answer(0)
- True False(0)
- Matching(0)