Exam 13: Glm 2: Comparing Means Adjusted for Other Predictors Analysis of Covariance
Exam 1: Why Is My Evil Lecturer Forcing Me to Learn Statistics9 Questions
Exam 2: The Spine of Statistics25 Questions
Exam 3: The Phoenix of Statistics16 Questions
Exam 4: The Ibm Spss Statistics Environment25 Questions
Exam 5: Exploring Data With Graphs12 Questions
Exam 6: The Beast of Bias23 Questions
Exam 7: Non-Parametric Models20 Questions
Exam 8: Correlation23 Questions
Exam 9: The Linear Model Regression20 Questions
Exam 10: Comparing Two Means25 Questions
Exam 11: Moderation, Mediation and Multicategory Predictors16 Questions
Exam 12: Glm 1: Comparing Several Independent Means22 Questions
Exam 13: Glm 2: Comparing Means Adjusted for Other Predictors Analysis of Covariance25 Questions
Exam 14: Glm 3: Factorial Designs25 Questions
Exam 15: Glm 4: Repeated-Measures Designs24 Questions
Exam 16: Glm 5: Mixed Designs17 Questions
Exam 17: Multivariate Analysis of Variance Manova19 Questions
Exam 18: Exploratory Factor Analysis22 Questions
Exam 19: Categorical Outcomes: Chi-Square and Loglinear Analysis24 Questions
Exam 20: Categorical Outcomes: Logistic Regression24 Questions
Exam 21: Multilevel Linear Models9 Questions
Select questions type
In an experiment to study the effectiveness of three different teaching programmes on children's achievement in mathematics, what might not be an appropriate covariate?
(Multiple Choice)
4.9/5  (34)
(34)
What does the relationship of the data in the following scatterplot indicate? 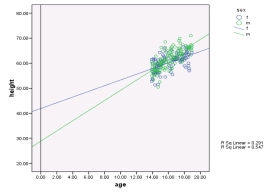
(Multiple Choice)
4.9/5 (39)
A music teacher had noticed that some students went to pieces during exams. He wanted to test whether this performance anxiety was different for people playing different instruments. He took groups of guitarists, drummers and pianists (variable = 'Instru') and measured their anxiety (variable = 'Anxiety') during the exam. He also noted the type of exam they were performing (in the UK, musical instrument exams are known as 'grades' and range from 1 to 8). He wanted to see whether the type of instrument played affected performance anxiety when controlling for the grade of the exam. The SPSS output below shows the final tables. Which of the following statements best reflects what these tables tells us? 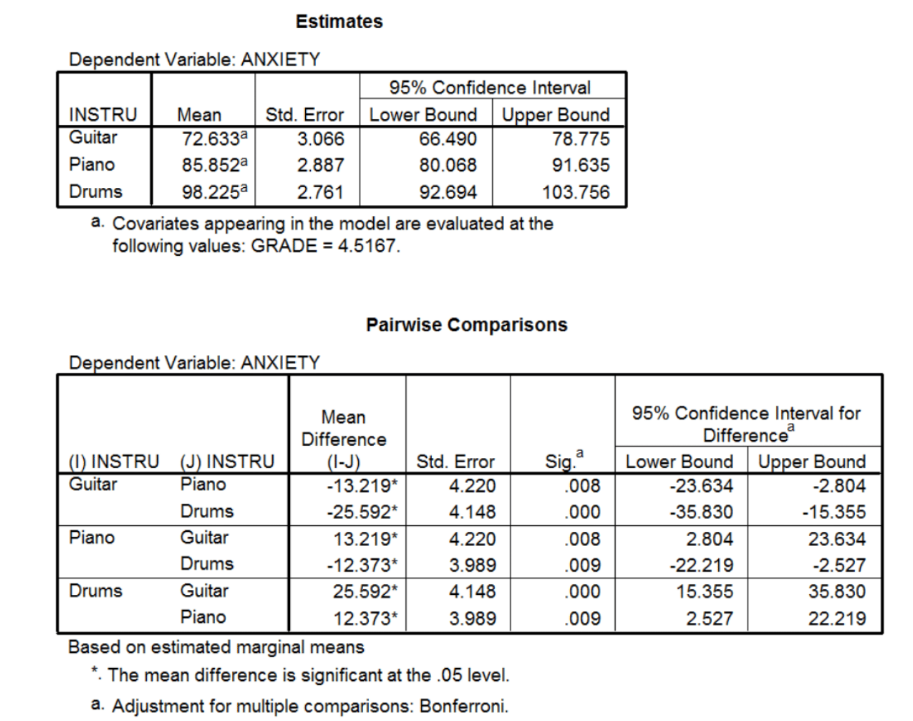
(Multiple Choice)
4.8/5 (35)
In a study of favourable effects of berry consumption on platelet formation, blood pressure and HDL cholesterol, the following results are reported Berry consumption inhibited platelet function as measured with a platelet function analyzer (using collagen and ADP as platelet activator) [changes: 11% and -1.4% in the berry and control groups, respectively; P=0.018, ANCOVA]. Plasma biomarkers of platelet activation, coagulation and fibrinolysis did not change during the intervention. Serum HDL-cholesterol concentrations increased significantly more (P=0.006, ANCOVA) in the berry than in the control group (5.2% and 0.6%, respectively), but total cholesterol and triacylglycerol remained unchanged. Systolic BP decreased significantly (P=0.050, ANCOVA). Polyphenol and vitamin C concentrations in plasma increased, whereas other nutritional biomarkers (i.e. folate, tocopherols, sodium and potassium) were unaffected.
Source: Erlund, I., Koli, R., Marniemi, J., Puuka, P., Mustonen, P. Mattila, P. & Jula, A. (2008). Favourable effects of berry consumption on platelet function, blood pressure and HDL cholesterol. American Journal of Clinical Nutrition, 87(2). 323-331.
Which of the following would you consider a possible conclusion from this report?
(Multiple Choice)
4.9/5 (34)
Under what circumstances would you not consider using analysis of covariance?
(Multiple Choice)
4.7/5 (32)
Filters
- Essay(0)
- Multiple Choice(0)
- Short Answer(0)
- True False(0)
- Matching(0)