Exam 6: The Beast of Bias
Exam 1: Why Is My Evil Lecturer Forcing Me to Learn Statistics26 Questions
Exam 2: The Spine of Statistics26 Questions
Exam 3: The Phoenix of Statistics16 Questions
Exam 4: The Ibm Spss Statistics Environment22 Questions
Exam 5: Exploring Data With Graphs21 Questions
Exam 6: The Beast of Bias25 Questions
Exam 7: Non-Parametric Models47 Questions
Exam 8: Correlation25 Questions
Exam 9: The Linear Model Regression23 Questions
Exam 10: Comparing Two Means24 Questions
Exam 11: Moderation, Mediation and Multicategory Predictors24 Questions
Exam 12: Glm 1: Comparing Several Independent Means46 Questions
Exam 13: Glm 2: Comparing Means Adjusted for Other Predictors Analysis of Covariance24 Questions
Exam 14: Glm 3: Factorial Designs21 Questions
Exam 15: Glm 4: Repeated-Measures Designs24 Questions
Exam 16: Glm 5: Mixed Designs22 Questions
Exam 17: Multivariate Analysis of Variance Manova25 Questions
Exam 18: Exploratory Factor Analysis25 Questions
Exam 19: Categorical Outcomes: Chi-Square and Loglinear Analysis24 Questions
Exam 20: Categorical Outcomes: Logistic Regression25 Questions
Exam 21: Multilevel Linear Models23 Questions
Select questions type
Based on the results for the skewness (Q21) and kurtosis (Q20) z-scores, which of the following descriptions best reflects the distribution assumptions of the MAP data?
(Multiple Choice)
4.8/5  (35)
(35)
Plot resting diastolic blood pressure as a histogram. You should get the histogram below. How would you describe its appearance? 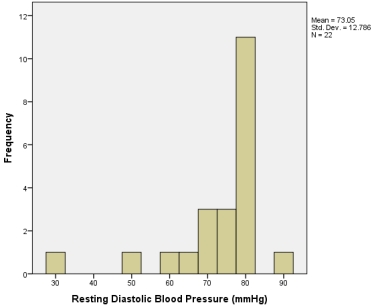
(Multiple Choice)
4.8/5 (42)
Use the compute function to create a new variable called mean arterial pressure (MAP). The equation you will need to enter is as follows: MAP = DBP+(0.333(SBP-DBP). Calculate the z-score for the kurtosis of the MAP data.
(Multiple Choice)
4.9/5 (39)
Calculate the z-score for the skewness of the resting heart rate data.
(Multiple Choice)
4.7/5 (33)
Split the data according to the sport. Run a Kolmogorov-Smirnov test on the diastolic blood pressure data. Which group's data cannot assume a normal distribution?
(Multiple Choice)
4.9/5 (30)
Filters
- Essay(0)
- Multiple Choice(0)
- Short Answer(0)
- True False(0)
- Matching(0)