Exam 7: Consumers, Producers, and the Efficiency of Markets
Exam 1: Ten Principles of Economics439 Questions
Exam 2: Thinking Like an Economist617 Questions
Exam 3: Interdependence and the Gains From Trade527 Questions
Exam 4: The Market Forces of Supply and Demand697 Questions
Exam 5: Elasticity and Its Application594 Questions
Exam 6: Supply, Demand, and Government Policies645 Questions
Exam 7: Consumers, Producers, and the Efficiency of Markets549 Questions
Exam 8: Application: the Costs of Taxation513 Questions
Exam 9: Application: International Trade492 Questions
Exam 10: Externalities524 Questions
Exam 11: Public Goods and Common Resources433 Questions
Exam 12: The Design of the Tax System549 Questions
Exam 13: The Costs of Production420 Questions
Exam 14: Firms in Competitive Markets543 Questions
Exam 15: Monopoly637 Questions
Exam 16: Monopolistic Competition580 Questions
Exam 17: Oligopoly488 Questions
Exam 18: The Markets for the Factors of Production564 Questions
Exam 19: Earnings and Discrimination490 Questions
Exam 20: Income Inequality and Poverty455 Questions
Exam 21: The Theory of Consumer Choice431 Questions
Exam 22: Frontiers of Microeconomics440 Questions
Exam 23: Measuring a Nations Income520 Questions
Exam 24: Measuring the Cost of Living529 Questions
Exam 25: Production and Growth505 Questions
Exam 26: Saving, Investment, and the Financial System564 Questions
Exam 27: The Basic Tools of Finance500 Questions
Exam 28: Unemployment678 Questions
Exam 29: The Monetary System515 Questions
Exam 30: Money Growth and Inflation481 Questions
Exam 31: Open-Economy Macroeconomics: Basic Concepts522 Questions
Exam 32: A Macroeconomic Theory of the Open Economy475 Questions
Exam 33: Aggregate Demand and Aggregate Supply562 Questions
Exam 34: The Influence of Monetary and Fiscal Policy on Aggregate Demand508 Questions
Exam 35: The Short-Run Trade-Off Between Inflation and Unemployment491 Questions
Exam 36: Six Debates Over Macroeconomic Policy372 Questions
Select questions type
Table 7-13
The numbers reveal the opportunity costs of providing 10 piano lessons of equal quality.  -Refer to Table 7-13. You wish to purchase 10 piano lessons for yourself and for your brother, so you take bids from each of the sellers. You will take lessons at the same time, so one teacher cannot provide lessons to both of you. You must pay the same price for both sets of lessons, and you will not accept a bid below a seller's cost because you are concerned that the seller will not provide all 10 lessons. What bid will you accept?
(Multiple Choice)
5.0/5  (30)
(30)
Figure 7-15 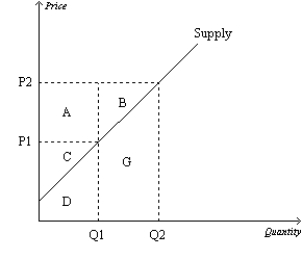 -Refer to Figure 7-15. When the price rises from P1 to P2, what area represents the increase in producer surplus?
(Multiple Choice)
4.9/5 (47)
Wendy is willing to pay $50 for a concert ticket and Bruce would like to receive $25. If the market price is $40 for this transaction, then the total surplus would be $15.
(True/False)
4.8/5 (47)
Table 7-4
The numbers in Table 7-1 reveal the maximum willingness to pay for a ticket to a Chicago Cubs vs. St. Louis Cardinal's baseball game at Wrigley Field.  -Refer to Table 7-4. If tickets sell for $40 each, then what is the total consumer surplus in the market?
A) $30.
A) $90.
B) $70.
D) $110.
-Refer to Table 7-4. If tickets sell for $40 each, then what is the total consumer surplus in the market?
A) $30.
A) $90.
B) $70.
D) $110.
(Short Answer)
4.9/5 (41)
Each seller of a product is willing to sell as long as the price he or she can receive is greater than the opportunity cost of producing the product.
(True/False)
4.9/5 (40)
If the government allowed a free market in organs for transplant there would be
(Multiple Choice)
4.8/5 (37)
Table 7-11
The following table represents the costs of five possible sellers.  -Refer to Table 7-11. If the market price is $1,200, the producer surplus in the market is
(Multiple Choice)
4.8/5 (37)
Figure 7-20 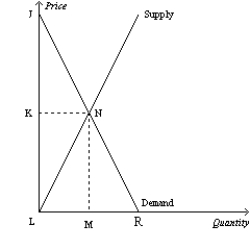 -Refer to Figure 7-20. Total surplus can be measured as the area
(Multiple Choice)
4.9/5 (40)
If a market is allowed to adjust freely to its equilibrium price and quantity, then an increase in demand will
(Multiple Choice)
4.8/5 (37)
Table 7-14
The only four producers in a market have the following costs:  -Refer to Table 7-14. If the sellers bid against each other for the right to sell the good to a single consumer, then the good will sell for
(Multiple Choice)
4.9/5 (37)
Table 7-5
For each of three potential buyers of oranges, the table displays the willingness to pay for the first three oranges of the day. Assume Allison, Bob, and Charisse are the only three buyers of oranges, and only three oranges can be supplied per day.  -Refer to Table 7-5. The market quantity of oranges demanded per day is exactly 7 if the price of an orange, P, satisfies
(Multiple Choice)
4.8/5 (41)
Figure 7-27 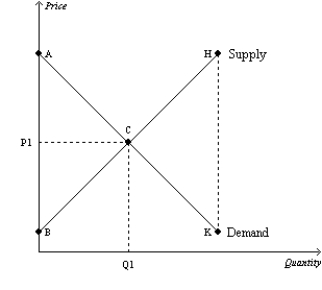 -Refer to Figure 7-27. Sellers whose costs are less than the equilibrium price are represented by which line segment?
(Multiple Choice)
4.9/5 (37)
Economists say that a market where goods are not consumed by those valuing the goods most highly is
(Multiple Choice)
4.8/5 (35)
Table 7-1  -Refer to Table 7-1. If the price of the product is $110, then who would be willing to purchase the product?
(Multiple Choice)
4.7/5 (36)
Many economists believe that restrictions against ticket scalping result in each of the following except
(Multiple Choice)
4.8/5 (32)
Figure 7-22  -Refer to Figure 7-22. At the equilibrium price, producer surplus is
(Multiple Choice)
4.8/5 (35)
Figure 7-18 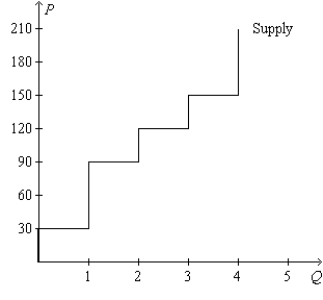 -Refer to Figure 7-18. Total surplus amounts to $500 if consumer surplus amounts to
(Multiple Choice)
4.9/5 (36)
Figure 7-16  -Refer to Figure 7-16. Sellers will be unwilling to sell more than
(Multiple Choice)
4.9/5 (44)
If a consumer places a value of $15 on a particular good and if the price of the good is $17, then the
(Multiple Choice)
4.8/5 (37)
Figure 7-10 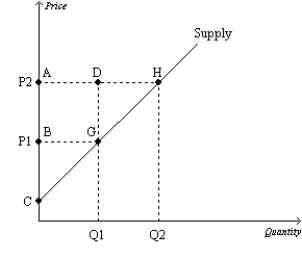 -Refer to Figure 7-10. Which area represents the increase in producer surplus when the price rises from P1 to P2?
(Multiple Choice)
4.8/5 (32)
Filters
- Essay(0)
- Multiple Choice(0)
- Short Answer(0)
- True False(0)
- Matching(0)