Exam 7: Consumers, Producers, and the Efficiency of Markets
Exam 1: Ten Principles of Economics439 Questions
Exam 2: Thinking Like an Economist617 Questions
Exam 3: Interdependence and the Gains From Trade527 Questions
Exam 4: The Market Forces of Supply and Demand697 Questions
Exam 5: Elasticity and Its Application594 Questions
Exam 6: Supply, Demand, and Government Policies645 Questions
Exam 7: Consumers, Producers, and the Efficiency of Markets549 Questions
Exam 8: Application: the Costs of Taxation513 Questions
Exam 9: Application: International Trade492 Questions
Exam 10: Externalities524 Questions
Exam 11: Public Goods and Common Resources433 Questions
Exam 12: The Design of the Tax System549 Questions
Exam 13: The Costs of Production420 Questions
Exam 14: Firms in Competitive Markets543 Questions
Exam 15: Monopoly637 Questions
Exam 16: Monopolistic Competition580 Questions
Exam 17: Oligopoly488 Questions
Exam 18: The Markets for the Factors of Production564 Questions
Exam 19: Earnings and Discrimination490 Questions
Exam 20: Income Inequality and Poverty455 Questions
Exam 21: The Theory of Consumer Choice431 Questions
Exam 22: Frontiers of Microeconomics440 Questions
Exam 23: Measuring a Nations Income520 Questions
Exam 24: Measuring the Cost of Living529 Questions
Exam 25: Production and Growth505 Questions
Exam 26: Saving, Investment, and the Financial System564 Questions
Exam 27: The Basic Tools of Finance500 Questions
Exam 28: Unemployment678 Questions
Exam 29: The Monetary System515 Questions
Exam 30: Money Growth and Inflation481 Questions
Exam 31: Open-Economy Macroeconomics: Basic Concepts522 Questions
Exam 32: A Macroeconomic Theory of the Open Economy475 Questions
Exam 33: Aggregate Demand and Aggregate Supply562 Questions
Exam 34: The Influence of Monetary and Fiscal Policy on Aggregate Demand508 Questions
Exam 35: The Short-Run Trade-Off Between Inflation and Unemployment491 Questions
Exam 36: Six Debates Over Macroeconomic Policy372 Questions
Select questions type
Table 7-17  -Refer to Table 7-17. Both the demand curve and the supply curve are straight lines. At equilibrium, total surplus is
(Multiple Choice)
4.9/5  (31)
(31)
If a consumer is willing and able to pay $20 for a particular good and if he pays $16 for the good, then for that consumer, consumer surplus amounts to
(Multiple Choice)
4.8/5 (30)
Figure 7-31 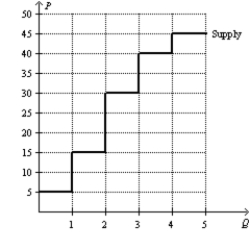 -Refer to Figure 7-31. If the market equilibrium price is $25, how much is total producer surplus in this market?
(Short Answer)
4.8/5 (32)
Figure 7-14 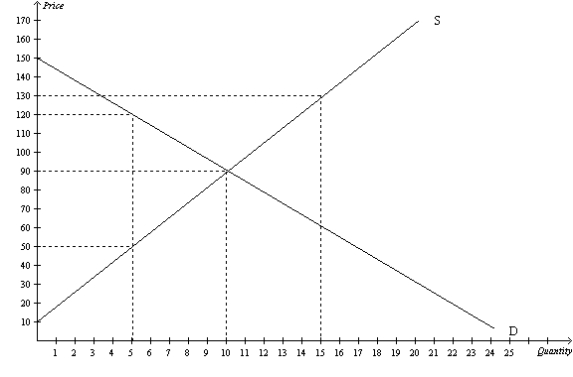 -Refer to Figure 7-14. If the government imposes a price ceiling of $50 in this market, then the new producer surplus will be
(Multiple Choice)
4.8/5 (34)
Table 7-2
This table refers to five possible buyers' willingness to pay for a case of Vanilla Coke.  -Refer to Table 7-2. Which of the following is not true?
(Multiple Choice)
5.0/5 (42)
Scenario 7-2
Suppose market demand and market supply are given by the equations:  -Refer to Scenario 7-2. Suppose a reduction in input prices shifts the market supply curve to
  How much total consumer surplus goes to new consumers who enter the market after the supply curve shifts?
(Essay)
4.8/5 (43)
Moving production from a high-cost producer to a low-cost producer will
(Multiple Choice)
4.9/5 (37)
All else equal, an increase in supply will cause an increase in consumer surplus.
(True/False)
5.0/5 (36)
In a competitive market, sales go to those producers who are willing to supply the product at the lowest price.
(True/False)
5.0/5 (35)
Figure 7-24 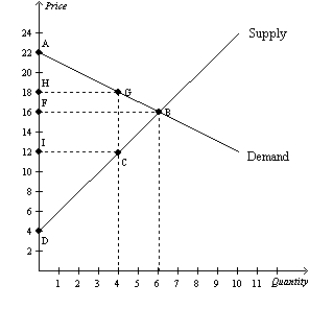 -Refer to Figure 7-24. If 4 units of the good are produced and sold, then
(Multiple Choice)
4.8/5 (30)
A seller is willing to sell a product only if the seller receives a price that is at least as great as the
(Multiple Choice)
4.8/5 (32)
Suppose that Firms A and B each produce high-resolution computer monitors, but Firm A can do so at a lower cost. Cassie and David each want to purchase a high-resolution computer monitor, but David is willing to pay more than Cassie. If Firm A produces a monitor that Cassie buys but David does not, then the market outcome illustrates which of the following principles?
(Multiple Choice)
4.9/5 (44)
The Surgeon General announces that eating apples promotes healthy teeth. As a result, the equilibrium price of apples
(Multiple Choice)
4.9/5 (30)
Figure 7-16 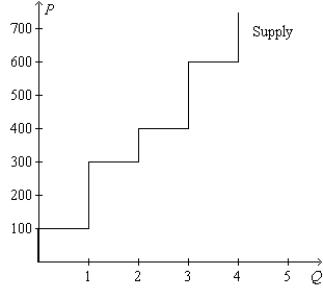 -Refer to Figure 7-16. If the price of the good is $300, then producer surplus amounts to
(Multiple Choice)
4.9/5 (32)
Figure 7-34  -Refer to Figure 7-34. Suppose there is initially a price ceiling set at $4 in this market. If the government removed the price ceiling, by how much would total producer surplus change?
(Essay)
4.8/5 (34)
Table 7-7  -Refer to Table 7-7. You are selling extra tickets to the Midwest Regional Sweet 16 game in the men's NCAA basketball tournament. The table shows the willingness to pay of the four potential buyers in the market for a ticket to the game. Which of the following graphs represents the market demand curve?
(Multiple Choice)
4.8/5 (27)
The lower the price, the lower the producer surplus, all else equal.
(True/False)
4.9/5 (36)
Filters
- Essay(0)
- Multiple Choice(0)
- Short Answer(0)
- True False(0)
- Matching(0)