Exam 9: A: large-Sample Tests of Hypotheses
Exam 1: Describing Data With Graphs134 Questions
Exam 2: Describing Data With Numerical Measures235 Questions
Exam 3: Describing Bivariate Data57 Questions
Exam 4: A: probability and Probability Distributions107 Questions
Exam 4: B: probability and Probability Distributions157 Questions
Exam 5: Several Useful Discrete Distributions166 Questions
Exam 6: The Normal Probability Distribution235 Questions
Exam 7: Sampling Distributions231 Questions
Exam 8: Large-Sample Estimation187 Questions
Exam 9: A: large-Sample Tests of Hypotheses154 Questions
Exam 9: B: large-Sample Tests of Hypotheses106 Questions
Exam 10: A: Inference From Small Samples192 Questions
Exam 10: B: Inference From Small Samples124 Questions
Exam 11: A: The Analysis of Variance136 Questions
Exam 11: B: The Analysis of Variance137 Questions
Exam 12: A: linear Regression and Correlation131 Questions
Exam 12: B: linear Regression and Correlation171 Questions
Exam 13: Multiple Regression Analysis232 Questions
Exam 14: Analysis of Categorical Data158 Questions
Exam 15: A:nonparametric Statistics139 Questions
Exam 15: B:nonparametric Statistics95 Questions
Select questions type
Assuming that all necessary conditions are met, what needs to be changed in the formula 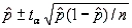 so that we can use it to construct a confidence interval estimate for the population proportion p?
A)
B)
C)
D)
so that we can use it to construct a confidence interval estimate for the population proportion p?
A)
B)
C)
D)
(Not Answered)
This question doesn't have any answer yet
A sample of size 150 from population 1 has 40 successes. A sample of size 250 from population 2 has 30 successes. What is the value of the test statistic for testing the null hypothesis that the proportion of successes in population one exceeds the proportion of successes in population two by 0.05?
(Multiple Choice)
4.7/5  (32)
(32)
In testing  vs.
vs. 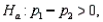 the following summary statistics are found:

 and
and  Based on these results, the null hypothesis should be rejected at the significance level
(True/False)
4.7/5 (41)
In testing the difference between two population means using two independent samples, the population standard deviations are assumed to be known, and the calculated test statistic equals 2.75. If the test is two-tailed and 5% level of significance has been specified, the conclusion should be not to reject the null hypothesis.
(True/False)
4.8/5 (32)
The p-value of a statistical test is the largest value of the significance level  for which the null hypothesis can be rejected.
(True/False)
4.8/5 (35)
The decision maker controls the probability of committing a Type I error.
(True/False)
4.9/5 (35)
When we test for differences between the means of two independent populations, we can use only a two-tailed test.
(True/False)
4.7/5 (34)
If you wish to conduct a hypothesis test using a small significance level  , you should increase your sample size to lower the probability of making a Type II error.
(True/False)
4.8/5 (29)
A Type I error for a statistical test is committed if we reject the null hypothesis when it is true.
(True/False)
4.9/5 (34)
If we do NOT reject the null hypothesis, what are we concluding?
(Multiple Choice)
5.0/5 (29)
With all other factors held constant, the chance of committing a Type II error increases if the true population mean  is closer to the hypothesized value
(True/False)
4.9/5 (37)
From a sample of 400 items, 14 are found to be defective. In this case, what is the point estimate of the population proportion defective?
(Multiple Choice)
4.7/5 (35)
In a two-tailed test, if the p-value is less than the probability of committing a Type I error, what can you conclude?
(Multiple Choice)
4.8/5 (40)
The necessary conditions having been met, a two-tailed test is being conducted to test the difference between two population means, but your statistical software provides only a one-tail area of 0.036 as part of its output. What is the p-value for this test?
(Multiple Choice)
4.8/5 (32)
If the null hypothesis  is rejected at the 0.05 level of significance, it must be rejected at the 0.01 level.
(True/False)
4.9/5 (39)
If a hypothesis test leads to incorrectly rejecting the null hypothesis, a Type II error has been committed.
(True/False)
4.9/5 (39)
The significance level in a hypothesis test for the difference between two population means is the same as the probability of committing a Type I error.
(True/False)
4.9/5 (30)
The necessary conditions having been met, a two-tailed test is being conducted for the difference between two population proportions. If the value of the test statistic is -1.35, then the p-value is 0.0885.
(True/False)
4.9/5 (28)
In testing  vs.
vs.  at
at  any p-value greater than 0.025 will lead to a rejection of the null hypothesis.
(True/False)
4.9/5 (37)
Filters
- Essay(0)
- Multiple Choice(0)
- Short Answer(0)
- True False(0)
- Matching(0)