Exam 2: Describing Data With Numerical Measures
Exam 1: Describing Data With Graphs134 Questions
Exam 2: Describing Data With Numerical Measures235 Questions
Exam 3: Describing Bivariate Data57 Questions
Exam 4: A: probability and Probability Distributions107 Questions
Exam 4: B: probability and Probability Distributions157 Questions
Exam 5: Several Useful Discrete Distributions166 Questions
Exam 6: The Normal Probability Distribution235 Questions
Exam 7: Sampling Distributions231 Questions
Exam 8: Large-Sample Estimation187 Questions
Exam 9: A: large-Sample Tests of Hypotheses154 Questions
Exam 9: B: large-Sample Tests of Hypotheses106 Questions
Exam 10: A: Inference From Small Samples192 Questions
Exam 10: B: Inference From Small Samples124 Questions
Exam 11: A: The Analysis of Variance136 Questions
Exam 11: B: The Analysis of Variance137 Questions
Exam 12: A: linear Regression and Correlation131 Questions
Exam 12: B: linear Regression and Correlation171 Questions
Exam 13: Multiple Regression Analysis232 Questions
Exam 14: Analysis of Categorical Data158 Questions
Exam 15: A:nonparametric Statistics139 Questions
Exam 15: B:nonparametric Statistics95 Questions
Select questions type
The following five-number summary for a sample of size 500 was obtained: Minimum = 250, 

 and Maximum = 4,950. Based on this information, if you were to construct a box plot, the value corresponding to the upper fence is 10,200.
(True/False)
4.8/5  (22)
(22)
For Labrador Retrievers, the average weight at 12 months of age is 23 kg, with a standard deviation of 1.2 kg. What can be said about the proportion of 12-month-old Labrador Retrievers that will weigh between 21.2 kg and 24.8 kg?
(Essay)
4.7/5 (30)
Measures of centre are values around which observations tend to cluster and which describe the location of what, in some sense, might be called the "centre" of a data set.
(True/False)
4.7/5 (32)
Student Extroversion
Thirty-three students were asked to rate themselves on whether they were outgoing or not using this five-point scale: 1 = extremely extroverted, 2 = extroverted, 3 = neither extroverted nor introverted, 4 = introverted, or 5 = extremely introverted. The results are shown in the table below: 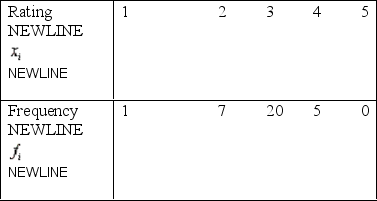 -Refer to the Student Extroversion statement and table. Calculate the sample standard deviation.
(Short Answer)
4.8/5 (31)
The distribution of a set of data is considered to be symmetric if the first quartile and the 25th percentile are equal.
(True/False)
4.8/5 (40)
Height of Basketball Players
A sample of basketball players has a mean height of 190 cm, with a standard deviation of 12 cm. You know nothing else about the size of the data set or the shape of the data distribution.
-Refer to the Height of Basketball Players statement. What can you say about the fraction of measurements that fall between 166 and 214?
(Essay)
4.8/5 (42)
Aptitude Tests
Twenty-eight applicants interested in working in community services took an examination designed to measure their aptitude for social work. A stem-and-leaf plot of the 28 scores appears below, in which the first column is the count per "branch," the second column is the stem value, and the remaining digits are the leaves.
Count Stems Leaves
1 4 6
1 5 9
4 6 3688
6 7 026799
9 8 145667788
7 9 1234788
-Refer to Aptitude Tests table. What is the value of the first and third quartiles?
(Essay)
4.8/5 (29)
Tchebysheff's Theorem provides us with a measure of the shape of a set of data that focuses on the difference between the mode and the mean, and then relates it to the standard deviation.
(True/False)
5.0/5 (31)
Which of the following summary measures is most affected by outliers?
(Multiple Choice)
4.8/5 (39)
The expression 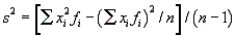 ;
;  is recognizable as the formula for which of the following measures?
(Multiple Choice)
4.8/5 (31)
Parasites in Foxes
A random sample of 100 foxes was examined by a team of veterinarians to determine the prevalence of a particular type of parasite. Counting the number of parasites per fox, the veterinarians found that 65 foxes had no parasites, 20 had one parasite, and so on. A frequency tabulation of the data is given here:  -Refer to the Parasites in Foxes statement and table. Construct a relative frequency histogram for x, the number of parasites per fox.
(Essay)
4.8/5 (37)
The following five-number summary for a sample of size 500 was obtained: Minimum = 250, 

 and Maximum = 4,950. Based on this information, if you were to construct a box plot, the value 215 would be considered an outlier.
(True/False)
4.9/5 (34)
In order to measure the variability in the same units as the original observations, we compute the sample variance.
(True/False)
4.8/5 (34)
Parasites in Foxes
A random sample of 100 foxes was examined by a team of veterinarians to determine the prevalence of a particular type of parasite. Counting the number of parasites per fox, the veterinarians found that 65 foxes had no parasites, 20 had one parasite, and so on. A frequency tabulation of the data is given here:
-Refer to the Parasites in Foxes statement and table. Calculate the sample mean  and sample standard deviation
  for the sample.
(Essay)
4.9/5 (35)
Aptitude Tests
Twenty-eight applicants interested in working in community services took an examination designed to measure their aptitude for social work. A stem-and-leaf plot of the 28 scores appears below, in which the first column is the count per "branch," the second column is the stem value, and the remaining digits are the leaves.
Count Stems Leaves
1 4 6
1 5 9
4 6 3688
6 7 026799
9 8 145667788
7 9 1234788
-Refer to Aptitude Tests table. What is the range of these data?
(Short Answer)
4.9/5 (33)
You are given a distribution of measurements that is approximately mound-shaped. According to the Empirical Rule, what would be the approximate percentage of measurements in a data set that will fall within two standard deviations of their mean?
(Multiple Choice)
4.9/5 (37)
Parasites in Foxes
A random sample of 100 foxes was examined by a team of veterinarians to determine the prevalence of a particular type of parasite. Counting the number of parasites per fox, the veterinarians found that 65 foxes had no parasites, 20 had one parasite, and so on. A frequency tabulation of the data is given here:
-The times required to service customers' cars at a repair shop are skewed to the right, with a mean of 2.5 hours and a standard deviation of 0.75 hours. What can be said about the percentage of cars whose service time is either less than 1 hour or more than 4 hours?
(Essay)
4.9/5 (29)
Aptitude Tests
Twenty-eight applicants interested in working in community services took an examination designed to measure their aptitude for social work. A stem-and-leaf plot of the 28 scores appears below, in which the first column is the count per "branch," the second column is the stem value, and the remaining digits are the leaves.
Count Stems Leaves
1 4 6
1 5 9
4 6 3688
6 7 026799
9 8 145667788
7 9 1234788
-Refer to Aptitude Tests table. What is the value of the sample standard deviation?
(Short Answer)
4.8/5 (31)
Athletic Training Time
The following data represent the numbers of minutes an athlete spends training per day: 73, 74, 76, 77, 79, 79, 83, 84, 88, 84, 84, 85, 86, 86, 87, 87, 88, 91, 92, 92, 93, 97, 98, 98, 81, and 82. The mean and standard deviation were computed to be 85.54 and 6.97, respectively.
-Refer to the Athletic Training Time statement. What percentage of measurements would you expect to be between 71.60 and 99.48?
(Essay)
4.9/5 (35)
Athletic Training Time
The following data represent the numbers of minutes an athlete spends training per day: 73, 74, 76, 77, 79, 79, 83, 84, 88, 84, 84, 85, 86, 86, 87, 87, 88, 91, 92, 92, 93, 97, 98, 98, 81, and 82. The mean and standard deviation were computed to be 85.54 and 6.97, respectively.
-Refer to the Athletic Training Time statement. Is the distribution relatively mound-shaped?
(Essay)
4.9/5 (31)
Filters
- Essay(0)
- Multiple Choice(0)
- Short Answer(0)
- True False(0)
- Matching(0)