Exam 2: Describing Data With Numerical Measures
Exam 1: Describing Data With Graphs134 Questions
Exam 2: Describing Data With Numerical Measures235 Questions
Exam 3: Describing Bivariate Data57 Questions
Exam 4: A: probability and Probability Distributions107 Questions
Exam 4: B: probability and Probability Distributions157 Questions
Exam 5: Several Useful Discrete Distributions166 Questions
Exam 6: The Normal Probability Distribution235 Questions
Exam 7: Sampling Distributions231 Questions
Exam 8: Large-Sample Estimation187 Questions
Exam 9: A: large-Sample Tests of Hypotheses154 Questions
Exam 9: B: large-Sample Tests of Hypotheses106 Questions
Exam 10: A: Inference From Small Samples192 Questions
Exam 10: B: Inference From Small Samples124 Questions
Exam 11: A: The Analysis of Variance136 Questions
Exam 11: B: The Analysis of Variance137 Questions
Exam 12: A: linear Regression and Correlation131 Questions
Exam 12: B: linear Regression and Correlation171 Questions
Exam 13: Multiple Regression Analysis232 Questions
Exam 14: Analysis of Categorical Data158 Questions
Exam 15: A:nonparametric Statistics139 Questions
Exam 15: B:nonparametric Statistics95 Questions
Select questions type
You are given a sample of 8 measurements: 13, 11, 15, 16, 14, 14, 13, and 15. Calculate the sample mean.
(Essay)
4.9/5  (44)
(44)
According to Tchebysheff's Theorem, at least 96% of observations should fall within five standard deviations of the mean.
(True/False)
4.7/5 (32)
Jessica has been keeping track of what she spends to eat out. Last week's expenditures for meals eaten out were $15.69, $15.95, $16.19, $20.91, $17.49, $24.53, and $17.66. The mean amount Jessica spends on meals is $18.35.
(True/False)
4.7/5 (32)
Optometrist Customers
The following values denote the number of customers handled by an optometrist during a random sample of four periods of one hour each: 4, 6, 2, and 5.
-Refer to the Optometrist Customers statement. Find the range R.
(Short Answer)
4.9/5 (35)
In a histogram, what may one conclude about the proportion of the total area that must be to the left of the median?
(Multiple Choice)
4.9/5 (38)
Cracks in Bar
The following data represent the number of small cracks per bar for a sample of eight steel bars: 4, 6, 10, 1, 3, 1, 25, and 8.
-Refer to Cracks in Bar statement. Find the standard deviation for the number of small cracks per bar.
(Essay)
4.9/5 (31)
The value of the standard deviation may be either positive or negative, while the value of the variance will always be positive or zero.
(True/False)
4.8/5 (41)
Frequency Table
Suppose you are given the following frequency table of ratings from 0 to 8: 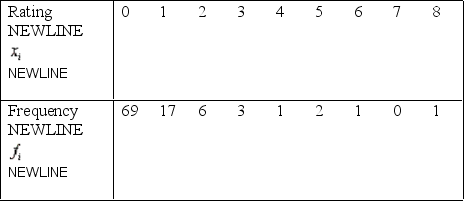 Assume that the sample mean and the sample standard deviation are 0.66 and 1.387, respectively.
-Refer to the Frequency Table. What fraction of the x-values fall within two standard deviations of the mean? Within three standard deviations of the mean?
Assume that the sample mean and the sample standard deviation are 0.66 and 1.387, respectively.
-Refer to the Frequency Table. What fraction of the x-values fall within two standard deviations of the mean? Within three standard deviations of the mean?
(Essay)
4.9/5 (41)
Tchebysheff's Theorem gives a lower bound to the fraction of measurements to be found in an interval constructed as  .
.
(True/False)
4.8/5 (33)
Motor Skills of Children
The times required for 10 children to learn a particular motor skill were recorded as 9, 15, 23, 20, 16, 15, 24, 18, 10, and 20 minutes.
-Refer to Motor Skills of Children statement. Find the mean time to learn this task.
(Essay)
4.8/5 (30)
The distribution of credit card balances for customers is highly skewed to the right, with a mean of $1200 and a standard deviation of $150. Based on this information, approximately 68% of the customers will have credit card balances between $1050 and $1350.
(True/False)
4.9/5 (33)
Aptitude Tests
Twenty-eight applicants interested in working in community services took an examination designed to measure their aptitude for social work. A stem-and-leaf plot of the 28 scores appears below, in which the first column is the count per "branch," the second column is the stem value, and the remaining digits are the leaves.
Count Stems Leaves
1 4 6
1 5 9
4 6 3688
6 7 026799
9 8 145667788
7 9 1234788
-Refer to Aptitude Tests table. Find the outer fences.
(Essay)
4.8/5 (39)
The lengths of screws produced by a machine are normally distributed, with a mean of 3 cm and a standard deviation of 0.2 cm. What can we conclude from this?
(Multiple Choice)
4.8/5 (36)
According to Tchebysheff's Theorem, what is the percentage of measurements in a data set that will fall within three standard deviations of the mean?
(Multiple Choice)
4.8/5 (35)
A sample of 50 values produced the following summary statistics: 

 and
and  Based on this information, what are the left and right ends, respectively, of the box plot using whiskers?
(Multiple Choice)
4.7/5 (39)
The following data represent scores on a 15-point aptitude test: 8, 10, 15, 12, 14, and 13. Subtract 5 from every observation and compute the sample mean for both the original data and the new data. What effect, if any, does subtracting 5 from every observation have on the sample mean?
(Essay)
4.9/5 (31)
Student Ratings
Thirty-three students were asked to rate themselves on whether they were outgoing or not, using this five-point scale: 1 = extremely extroverted, 2 = extroverted, 3 = neither extroverted nor introverted, 4 = introverted, or 5 = extremely introverted. The results are shown in the table below:  -Refer to Student Ratings table. Calculate the sample mean.
(Essay)
4.8/5 (31)
Aptitude Tests
Twenty-eight applicants interested in working in community services took an examination designed to measure their aptitude for social work. A stem-and-leaf plot of the 28 scores appears below, in which the first column is the count per "branch," the second column is the stem value, and the remaining digits are the leaves.
Count Stems Leaves
1 4 6
1 5 9
4 6 3688
6 7 026799
9 8 145667788
7 9 1234788
-Refer to Aptitude Tests table. Find the inner fences.
(Essay)
4.9/5 (28)
The sample variance calculated with a divisor of n gives a better estimate of the population variance, 2, than does the sample variance, s2, with a divisor of n - 1.
(True/False)
4.8/5 (37)
A sample of n = 10 measurements consists of the following values: 15, 12, 13, 16, 11, 12, 14, 15, 11, and 13.
a. Can you use Tchebysheff's Theorem to describe this data set? Why or why not?
b. Can you use the Empirical Rule to describe this data set? Why or why not?
(Essay)
4.9/5 (36)
Filters
- Essay(0)
- Multiple Choice(0)
- Short Answer(0)
- True False(0)
- Matching(0)