Exam 23 Managing Quality
Exam 1: Operations and Productivity126 Questions
Exam 2: Operations Strategy in a Global Environment135 Questions
Exam 3: Project Management123 Questions
Exam 4: Forecasting142 Questions
Exam 5: Design of Goods and Services137 Questions
Exam 6: Managing Quality130 Questions
Exam 7: Process Strategy129 Questions
Exam 8: Location Strategies140 Questions
Exam 9: Layout Strategies161 Questions
Exam 10: Human Resources, Job Design, and Work Measurement191 Questions
Exam 11: Supply-Chain Management145 Questions
Exam 12: Inventory Management171 Questions
Exam 13: Aggregate Planning134 Questions
Exam 14: Material Requirements Planning Mrp and Erp172 Questions
Exam 15: Short-Term Scheduling139 Questions
Exam 16: Just-In-Time and Lean Options138 Questions
Exam 17: Maintenance and Reliability130 Questions
Exam 18: Statistical Tools for Managers97 Questions
Exam 19: Acceptance Sampling99 Questions
Exam 20: The Simplex Method of Linear Programming94 Questions
Exam 21: The Modi and Vam Methods of Solving Transportation Problems135 Questions
Exam 22: Vehicle Routing and Scheduling111 Questions
Exam 23 Managing Quality155 Questions
Exam 24: Process Strategy107 Questions
Exam 25: Supply-Chain Management73 Questions
Exam 26: Vehicle Routing and Scheduling92 Questions
Select questions type
A Cpk index of 1.00 equates to a defect rate of
Free
(Multiple Choice)
4.7/5  (37)
(37)
Correct Answer: Verified
C
If a sample of items is taken and the mean of the sample is outside the control limits the process is
Free
(Multiple Choice)
4.7/5 (35)
Correct Answer:Verified
A
A lot that is accepted by acceptance sampling is certified to be free of defects.
Free
(True/False)
4.8/5 (34)
Correct Answer:Verified
False
The purpose of process control is to detect when natural causes of variation are present.
(True/False)
4.7/5 (39)
A retail store manager is trying to improve and control the rate at which cashiers sign customers up for store credit cards. Suppose that the manager wants the maximum standard deviation of the sampling distribution to be 5% and he cannot estimate p-bar. How many observations per sample would this require?
(Essay)
4.8/5 (32)
A process is said to be in statistical control when assignable causes are the only sources of variation.
(True/False)
4.9/5 (35)
A Cpk index greater than __________ is a capable process, one that generates fewer than 2.7 defects per 1000 at the ±3σ level.
(Short Answer)
4.8/5 (41)
A part that connects two levels should have a distance between the two holes of 4". It has been determined that x-bar and R-charts should be set up to determine if the process is in statistical control. The following ten samples of size four were collected. Calculate the control limits, plot the control charts, and determine if the process is in control.
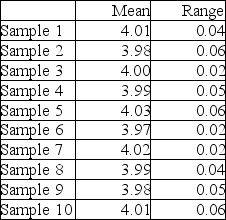
(Essay)
4.8/5 (27)
A normal distribution is generally described by its two parameters: the mean and the range.
(True/False)
4.9/5 (38)
A retail store manager is trying to improve and control the rate at which cashiers sign customers up
for store credit cards. After posting a p-chart of the store's credit card sign-ups the manager takes
new samples of size 50 three weeks later. He finds that each sample of 50 contained 5 credit card
signups on average. Find p-bar and 99.73% control limits.
(Essay)
4.9/5 (39)
The Cpk index measures the difference between desired and actual dimensions of goods or services produced.
(True/False)
4.9/5 (33)
The acceptable quality level (AQL) is the average level of quality we are willing to accept.
(True/False)
4.7/5 (25)
The number of defects after a hotel room cleaning (sheets not straight, smears on mirror, missed debris on carpet, etc) should be measured using a(n)
(Multiple Choice)
4.8/5 (41)
McDaniel Shipyards wants to develop control charts to assess the quality of its steel plate. They take ten sheets of 1" steel plate and compute the number of cosmetic flaws on each roll. Each sheet is 20' by 100'. Based on the following data, develop limits for the control chart, plot the control chart, and determine whether the process is in control.
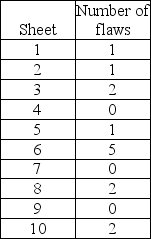
(Essay)
4.9/5 (31)
The __________ is a quality control chart that indicates when changes occur in the central tendency of a production process.
(Short Answer)
4.8/5 (37)
Filters
- Essay(0)
- Multiple Choice(0)
- Short Answer(0)
- True False(0)
- Matching(0)