Exam 21: Statistical Process Control
Exam 1: What Is Statistics39 Questions
Exam 2: Graphical Descriptive Techniques I89 Questions
Exam 3: Graphical Descriptive Techniques II179 Questions
Exam 4: A: Numerical Descriptive Techniques202 Questions
Exam 4: B: Numerical Descriptive Techniques39 Questions
Exam 4: C: Numerical Descriptive Techniques18 Questions
Exam 5: Data Collection and Sampling76 Questions
Exam 6: Probability223 Questions
Exam 7: A: Random Variables and Discrete Probability Distributions225 Questions
Exam 7: B: Random Variables and Discrete Probability Distributions44 Questions
Exam 8: Continuous Probability Distributions200 Questions
Exam 9: Sampling Distributions150 Questions
Exam 10: Introduction to Estimation143 Questions
Exam 11: Introduction to Hypothesis Testing179 Questions
Exam 12: Inference About a Population149 Questions
Exam 13: Inference About Comparing Two Populations169 Questions
Exam 14: Analysis of Variance154 Questions
Exam 15: Chi-Squared Tests174 Questions
Exam 16: A: Simple Linear Regression and Correlation246 Questions
Exam 16: B: Simple Linear Regression and Correlation47 Questions
Exam 17: Multiple Regression156 Questions
Exam 18: Model Building137 Questions
Exam 19: Nonparametric Statistics171 Questions
Exam 20: Time-Series Analysis and Forecasting217 Questions
Exam 21: Statistical Process Control133 Questions
Exam 22: Decision Analysis121 Questions
Exam 23: Conclusion45 Questions
Select questions type
To construct a p chart,draw samples of size n,and for each sample calculate the sample ____________________ of defective units.
(Essay)
4.9/5  (32)
(32)
Assignable variation is caused by specific events or factors that are frequently temporary.
(True/False)
4.9/5 (33)
Sample proportions that are ____________________ than the lower control limit of a p chart indicate a change in the process that we would like to keep.
(Essay)
4.9/5 (29)
The mean of the sample means and the pooled standard deviation of 50 samples of size 10 taken from a production process under control are found to be 225 and 16,respectively.The upper control limit for the chart is:
(Multiple Choice)
4.8/5 (28)
Samples Production
Thirty samples of size 4 were drawn from a production process.The data are shown below.
 -{30 Samples Production Narrative} Calculate the mean and standard deviation of each sample.
(Essay)
4.8/5 (29)
Samples Production
25 samples of size 4 were taken from a manufacturing process.The mean of the sample means and the pooled standard deviation are ,and S = 3.5,respectively.The sample means are listed below.
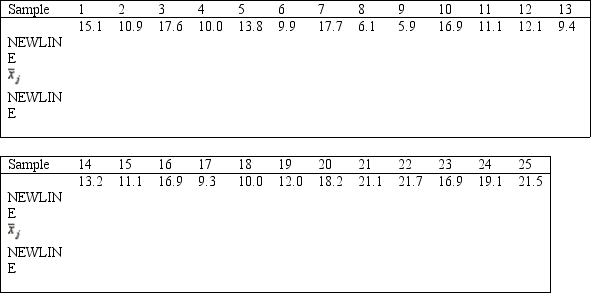 -{25 Samples Production Narrative} Plot the sample means on the chart.
(Essay)
4.8/5 (34)
If the lower control limit of a p chart is negative,set it equal to ____________________.
(Essay)
4.8/5 (34)
____________________ variation is caused by specific events or factors that are frequently temporary.
(Essay)
4.9/5 (36)
If a control chart finds six increasing or six decreasing points in a row,this is an example of assignable cause variation called a(n)____________________.
(Essay)
4.9/5 (33)
A process capability index Cp of 1.0 describes a production where the difference in the specification limits is equal to 6 standard errors.
(True/False)
4.8/5 (38)
Which of the following process results indicate that a statistical process is out of control?
(Multiple Choice)
4.9/5 (36)
If a control chart finds the standard deviation in the means is increasing,this could be an indicator of assignable variation called ____________________.
(Essay)
4.8/5 (32)
Assume a process has limits set at 3 standard errors from the centerline.The average run length (ARL)is 385.What does this mean?
(Essay)
4.9/5 (28)
Diaper Delivery
Wrap-M-Up,a Ft.Lauderdale diaper Service,has 10 delivery men who each deliver diapers to 50 customers every day.Wrap-M-Up decides to record the proportion of diapers delivered on time for a 10-day period and construct a p chart to see whether the proportion is too erratic.The data are shown below:
Day 1 2 3 4 5 6 7 8 9 10 Prapartion of Dingers .916 .894 .928 .900 .864 .968 .914 .988 .952 .936 Delivered an Time
-{Diaper Delivery Narrative} Find the numerical value of the upper control limit for the p chart.
(Essay)
4.8/5 (33)
If a control chart finds fourteen points in a row that are alternating up and down,this is an example of assignable variation called a(n)____________________.
(Essay)
4.8/5 (36)
If the lower control limit for the p chart is negative,we set it equal to
(Multiple Choice)
4.8/5 (31)
A level shift is a change in the ____________________ of the process distribution.
(Essay)
4.8/5 (34)
Chance variation was built into the produce when the production process was first set up.
(True/False)
4.8/5 (38)
To determine whether the process distribution standard deviation has changed,we use a(n):
(Multiple Choice)
4.7/5 (27)
Filters
- Essay(0)
- Multiple Choice(0)
- Short Answer(0)
- True False(0)
- Matching(0)