Exam 21: Statistical Process Control
Exam 1: What Is Statistics39 Questions
Exam 2: Graphical Descriptive Techniques I89 Questions
Exam 3: Graphical Descriptive Techniques II179 Questions
Exam 4: A: Numerical Descriptive Techniques202 Questions
Exam 4: B: Numerical Descriptive Techniques39 Questions
Exam 4: C: Numerical Descriptive Techniques18 Questions
Exam 5: Data Collection and Sampling76 Questions
Exam 6: Probability223 Questions
Exam 7: A: Random Variables and Discrete Probability Distributions225 Questions
Exam 7: B: Random Variables and Discrete Probability Distributions44 Questions
Exam 8: Continuous Probability Distributions200 Questions
Exam 9: Sampling Distributions150 Questions
Exam 10: Introduction to Estimation143 Questions
Exam 11: Introduction to Hypothesis Testing179 Questions
Exam 12: Inference About a Population149 Questions
Exam 13: Inference About Comparing Two Populations169 Questions
Exam 14: Analysis of Variance154 Questions
Exam 15: Chi-Squared Tests174 Questions
Exam 16: A: Simple Linear Regression and Correlation246 Questions
Exam 16: B: Simple Linear Regression and Correlation47 Questions
Exam 17: Multiple Regression156 Questions
Exam 18: Model Building137 Questions
Exam 19: Nonparametric Statistics171 Questions
Exam 20: Time-Series Analysis and Forecasting217 Questions
Exam 21: Statistical Process Control133 Questions
Exam 22: Decision Analysis121 Questions
Exam 23: Conclusion45 Questions
Select questions type
To construct a chart,estimate the mean of the process distribution using the mean of the sample means,denoted by: ____________________.
(Essay)
4.8/5  (32)
(32)
If the upper and lower specification limits of a process are .852 and .828,respectively,and the process standard deviation is .002,then the process capability index Cp is
(Multiple Choice)
4.8/5 (37)
Control charts for variables are appropriate whenever we are interested in monitoring measurements,such as weights,diameters,or temperature.
(True/False)
4.7/5 (34)
You stopped a production process because you felt the process was out of control according to your control chart.However,it turns out the process was in control,costing you $20,000 in downtime of the equipment and laborers.This is an example of a costly Type____________ error.
(Essay)
5.0/5 (30)
Which of the following elements affects the chance of making a Type II error?
(Multiple Choice)
4.7/5 (24)
What are the null and alternative hypotheses used to determine whether or not a process is in control?
(Essay)
5.0/5 (37)
Assume that the control limits of an chart are defined as 2 standard errors above and below the centerline.Calculate the probability that a sample mean falls outside the control limits when the process is in fact under control.
(Essay)
4.9/5 (35)
For an control chart,you test a series of sample means.For each series of samples,we want to determine whether there is sufficient evidence to infer that the process mean has changed (i.e.reject H0: the process is under control).Under what situation would you reject the null hypothesis based on the control chart?
(Essay)
4.9/5 (37)
Samples Production
Thirty samples of size 4 were drawn from a production process.The data are shown below.
 -{30 Samples Production Narrative} Looking at the chart developed in a previous question,you see indications of a possible level shift as well as cyclic variation.Explain how the chart shows this,and give a possible explanation.
(Essay)
4.7/5 (26)
Samples Production
25 samples of size 4 were taken from a manufacturing process.The mean of the sample means and the pooled standard deviation are ,and S = 3.5,respectively.The sample means are listed below.
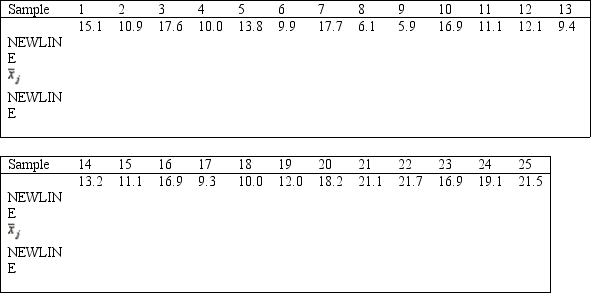 -{25 Samples Production Narrative} Find the centerline and control limits for the chart.
(Essay)
4.8/5 (33)
Samples Production
Thirty samples of size 4 were drawn from a production process.The data are shown below.
-{30 Samples Production Narrative} Construct an chart.
(Essay)
4.8/5 (31)
Chance variation ____________________ product quality and ____________________ costs.
(Essay)
4.8/5 (30)
A production facility produces 75 units per hour and uses an chart to monitor its quality.The control limits are seat at 2.5 standard errors from the mean.On average,how many units will be produced until the control chart signals that the process is out of control,when it is in fact under control?
(Essay)
4.9/5 (37)
The process capability index measures the capability of the process to produce units whose dimensions fall with in the specifications.
(True/False)
4.8/5 (29)
An chart for a normally distributed random variable has control limits set at 3 standard errors from the centerline.One sample mean falls outside the control limits when the process is actually under control.The probability that this happened by chance is:
(Multiple Choice)
4.9/5 (34)
Control charts that are used to monitor a process whose results are categorized as either defective or non-defective are called p charts.
(True/False)
5.0/5 (33)
To determine whether the distribution mean of a process has changed,we use a(n)____________________ chart.
(Essay)
4.8/5 (41)
Diaper Delivery
Wrap-M-Up,a Ft.Lauderdale diaper Service,has 10 delivery men who each deliver diapers to 50 customers every day.Wrap-M-Up decides to record the proportion of diapers delivered on time for a 10-day period and construct a p chart to see whether the proportion is too erratic.The data are shown below:
Day 1 2 3 4 5 6 7 8 9 10 Prapartion of Dingers .916 .894 .928 .900 .864 .968 .914 .988 .952 .936 Delivered an Time
-{Diaper Delivery Narrative} At which days is the process out of control?
(Essay)
4.9/5 (39)
To determine whether the process distribution standard deviation has changed,we use a(n)____________________ chart or a(n)____________________ chart.
(Essay)
4.7/5 (35)
Filters
- Essay(0)
- Multiple Choice(0)
- Short Answer(0)
- True False(0)
- Matching(0)