Exam 2: Descriptive Statistics and Analytics: Tabular and Graphical Methods
Exam 1: An Introduction to Business Statistics and Analytics98 Questions
Exam 2: Descriptive Statistics and Analytics: Tabular and Graphical Methods120 Questions
Exam 3: Descriptive Statistics and Analytics: Numerical Methods145 Questions
Exam 4: Probability and Probability Models150 Questions
Exam 5: Predictive Analytics I: Trees, K-Nearest Neighbors, Naive Bayes,101 Questions
Exam 6: Discrete Random Variables150 Questions
Exam 7: Continuous Random Variables150 Questions
Exam 8: Sampling Distributions111 Questions
Exam 9: Confidence Intervals149 Questions
Exam 10: Hypothesis Testing150 Questions
Exam 11: Statistical Inferences Based on Two Samples140 Questions
Exam 12: Experimental Design and Analysis of Variance132 Questions
Exam 13: Chi-Square Tests120 Questions
Exam 14: Simple Linear Regression Analysis147 Questions
Exam 15: Multiple Regression and Model Building85 Questions
Exam 16: Predictive Analytics Ii: Logistic Regression, Discriminate Analysis,101 Questions
Exam 17: Time Series Forecasting and Index Numbers161 Questions
Exam 18: Nonparametric Methods103 Questions
Exam 19: Decision Theory90 Questions
Select questions type
Sparklines always need to be displayed with either their axes or coordinates.
(True/False)
4.9/5  (38)
(38)
A local electronics retailer recently conducted a study on purchasers of large screen televisions. The study recorded the type of television and the credit account balance of the customer at the time of purchase. They obtained the following results.
 Construct a table of column percentages.
(Short Answer)
4.9/5 (42)
A histogram that has a longer tail extending toward smaller values is ________.
(Multiple Choice)
4.7/5 (36)
A(n) ________ is a graphical presentation of the current status and historical trends of a business's key performance indicators.
(Multiple Choice)
4.8/5 (33)
An unusually large or small observation separated from the rest of the data is a(n) ________.
(Multiple Choice)
4.8/5 (31)
The number of weekly sales calls by a sample of 25 pharmaceutical salespersons is below.
24, 56, 43, 35, 37, 27, 29, 44, 34, 28, 33, 28, 46, 31, 38, 41, 48, 38, 27, 29, 37, 33, 31, 40, 50
Construct a frequency polygon.
(Short Answer)
4.9/5 (31)
When establishing the classes for a frequency distribution, it is generally agreed that the more classes you use the better your frequency distribution will be.
(True/False)
4.8/5 (41)
A company collected the ages from a random sample of its middle managers, with the resulting frequency distribution shown below.  What is the midpoint of the third class interval?
(Multiple Choice)
4.8/5 (36)
A CFO is looking at what percentage of a company's resources are spent on computing. He samples companies in the pharmaceutical industry and develops the following stem-and-leaf display (leaf unit = 0.1). 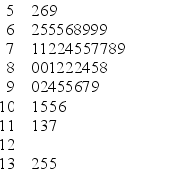 If you were creating a frequency histogram using these data, how many classes would you create?
(Multiple Choice)
4.8/5 (32)
A treemap displays information as a series of clustered rectangles.
(True/False)
4.8/5 (44)
A bullet graph features a single measure and displays it as either a horizontal or vertical bar.
(True/False)
4.9/5 (36)
Sparklines are line charts and are often embedded with the text where they are being discussed.
(True/False)
4.9/5 (35)
A CFO is looking at what percentage of a company's resources are spent on computing. He samples companies in the pharmaceutical industry and develops the following stem-and-leaf display (leaf unit = 0.1).  What would be the first class interval for the frequency histogram?
(Multiple Choice)
4.8/5 (33)
Recently an advertising company called 200 people and asked them to identify the company that was in an ad running nationwide. The following results were obtained.  What percentage of those surveyed could not correctly recall the company?
(Multiple Choice)
4.9/5 (39)
It is possible to create different interpretations of the same graphical display by simply using different captions.
(True/False)
4.8/5 (35)
The number of weekly sales calls by a sample of 25 pharmaceutical salespersons is below.
24, 56, 43, 35, 37, 27, 29, 44, 34, 28, 33, 28, 46, 31, 38, 41, 48, 38, 27, 29, 37, 33, 31, 40, 50
Construct an ogive of the weekly sales calls.
(Short Answer)
4.8/5 (30)
A CFO is looking at what percentage of a company's resources are spent on computing. He samples companies in the pharmaceutical industry and develops the following stem-and-leaf display (leaf unit = 0.1).  What would be the class length used in creating a frequency histogram?
(Multiple Choice)
4.9/5 (34)
The following is a relative frequency distribution of grades in an introductory statistics course.
 Construct a percent bar chart for this data.
(Short Answer)
4.8/5 (37)
Filters
- Essay(0)
- Multiple Choice(0)
- Short Answer(0)
- True False(0)
- Matching(0)