Exam 6: Statistical Methods in Quality Management
Exam 1: Introduction to Quality80 Questions
Exam 2: Foundations of Quality Management80 Questions
Exam 3: Customer Focus80 Questions
Exam 4: Workforce Focus80 Questions
Exam 5: Process Focus79 Questions
Exam 6: Statistical Methods in Quality Management94 Questions
Exam 7: Design for Quality and Product Excellence80 Questions
Exam 8: Measuring and Controlling Quality105 Questions
Exam 9: Process Improvement and Six Sigma80 Questions
Exam 10: The Baldrige Framework for Performance Excellence80 Questions
Exam 11: Strategy and Performance Excellence78 Questions
Exam 12: Measurement and Knowledge Management for Performance Excellence80 Questions
Exam 13: Leadership for Performance Excellence80 Questions
Exam 14: Building and Sustaining Quality and Performance Excellence77 Questions
Select questions type
Define binomial and Poisson distributions.State their probability functions.
(Essay)
4.9/5  (39)
(39)
A sample of size 16 is randomly selected from a population of size 90.Determine the standard error of the mean if the population standard deviation equals 20.
(Multiple Choice)
5.0/5 (30)
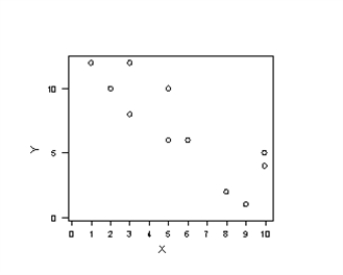
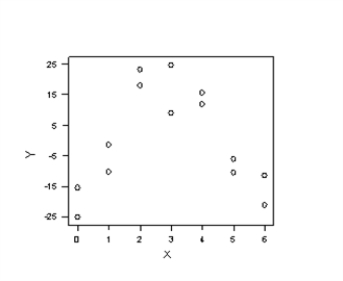
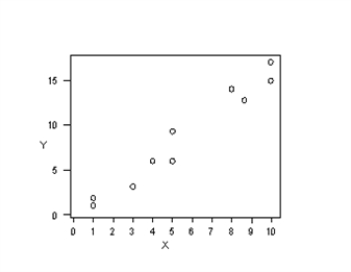
Three scatter diagrams are given below.How many of the diagrams present data that can be described by a linear relationship and,therefore,justifiably summarized by the correlation coefficient?
Plot A
 Plot B
 Plot C
(Multiple Choice)
4.8/5 (34)
Statistical methods help managers make sense of data and gain insight about the:
(Multiple Choice)
4.7/5 (37)
When interactions are present in an experiment,main effects have little meaning.
(True/False)
4.8/5 (43)
The component of statistical methodology that includes the collection,organization,and summarization of data is called:
(Multiple Choice)
4.8/5 (29)
The conditional probability of an event A given that event B is known is given by:
(Multiple Choice)
4.8/5 (30)
A frequency distribution is a table that shows the number of observations in each of several nonoverlapping groups.
(True/False)
4.8/5 (35)
The median specifies the middle value when the data are arranged from smallest to largest.
(True/False)
4.8/5 (30)
Statistics is a science concerned with the collection,organization,analysis,interpretation,and presentation of data.
(True/False)
4.9/5 (38)
A confidence interval is an interval estimate of a population parameter that also specifies the likelihood that the interval contains the true population parameter.
(True/False)
4.9/5 (42)
The Poisson distribution is closely related to the binomial distribution.
(True/False)
4.9/5 (35)
In regression analysis,_____ measures the proportion of the variation in the dependent variable that is explained by the independent variable(s).
(Multiple Choice)
4.7/5 (34)
A random variable is a numerical description of the outcome of an experiment.
(True/False)
5.0/5 (40)
A testing engineer in a light bulb factory is planning a study to estimate the average life of a large shipment of light bulbs.The engineer wants to estimate the average life within plus or minus 16 hours with 95 percent confidence.Assuming a process standard deviation of 90 hours,determine the sample size for this study.
(Multiple Choice)
4.8/5 (48)
In which of the following companies,a high level of soldering defects was observed,necessitating 100 percent inspection for all circuit boards??
(Multiple Choice)
4.9/5 (31)
The sum of the probabilities over all possible outcomes must be between 0 and 1.
(True/False)
4.8/5 (33)
Filters
- Essay(0)
- Multiple Choice(0)
- Short Answer(0)
- True False(0)
- Matching(0)