Exam 3: Visual Displays of Data
Exam 1: An Introduction to Statistics and Research Design156 Questions
Exam 2: Frequency Distributions89 Questions
Exam 3: Visual Displays of Data108 Questions
Exam 4: Central Tendency and Variability108 Questions
Exam 5: Sampling and Probability145 Questions
Exam 6: The Normal Curve, Standardization and Z Scores142 Questions
Exam 7: Hypothesis Testing With Z Tests141 Questions
Exam 8: Confidence Intervals, Effect Size, and Statistical Power147 Questions
Exam 9: The Single-Sample T Test124 Questions
Exam 10: The Paired-Samples T Test101 Questions
Exam 11: The Independent-Samples T Test99 Questions
Exam 12: One-Way Between-Groups Anova108 Questions
Exam 13: One-Way Within-Groups Anova102 Questions
Exam 14: Two-Way Between-Groups Anova115 Questions
Exam 15: Correlation139 Questions
Exam 16: Regression113 Questions
Exam 17: Chi-Square Tess120 Questions
Exam 18: Choosing and Reporting Statistics105 Questions
Select questions type
A student poll on your university website for athletics asks, "How high do you think the basketball team will finish this year: 1st, 2nd, 3rd, 4th, or 5th?" An article posted a week later reports "Students predict basketball team to finish within the top 5 out of 16 teams in the conference." What kind of manipulation occurred here?
(Multiple Choice)
4.9/5  (43)
(43)
In a pie chart, each slice represents a level on the _____ variable.
(Multiple Choice)
4.9/5 (41)
Pictorial graphs are sometimes used when the independent variables has _____ categories.
(Multiple Choice)
4.9/5 (41)
What should be kept in mind when organizing data in graphs?
(Multiple Choice)
4.8/5 (32)
In the _____ lie participants in a study are preselected, resulting in biased results.
(Multiple Choice)
4.8/5 (29)
A graph that depicts the relation between two scale variables is a:
(Multiple Choice)
4.8/5 (34)
If graphing one scale independent variable and one scale dependent variable, use a:
(Multiple Choice)
4.8/5 (35)
Any background pattern on which graphs appear is a form of chartjunk called:
(Multiple Choice)
4.9/5 (33)
A scatterplot with a line of best fit is known as a time line plot.
(True/False)
4.8/5 (40)
Use the following to answer questions
This figure depicts the typical relation found between a person's age (in years) and his or her reaction time in a simple reaction time task (e.g., time to press a button when a light turns green).
Figure: Age and Reaction Time 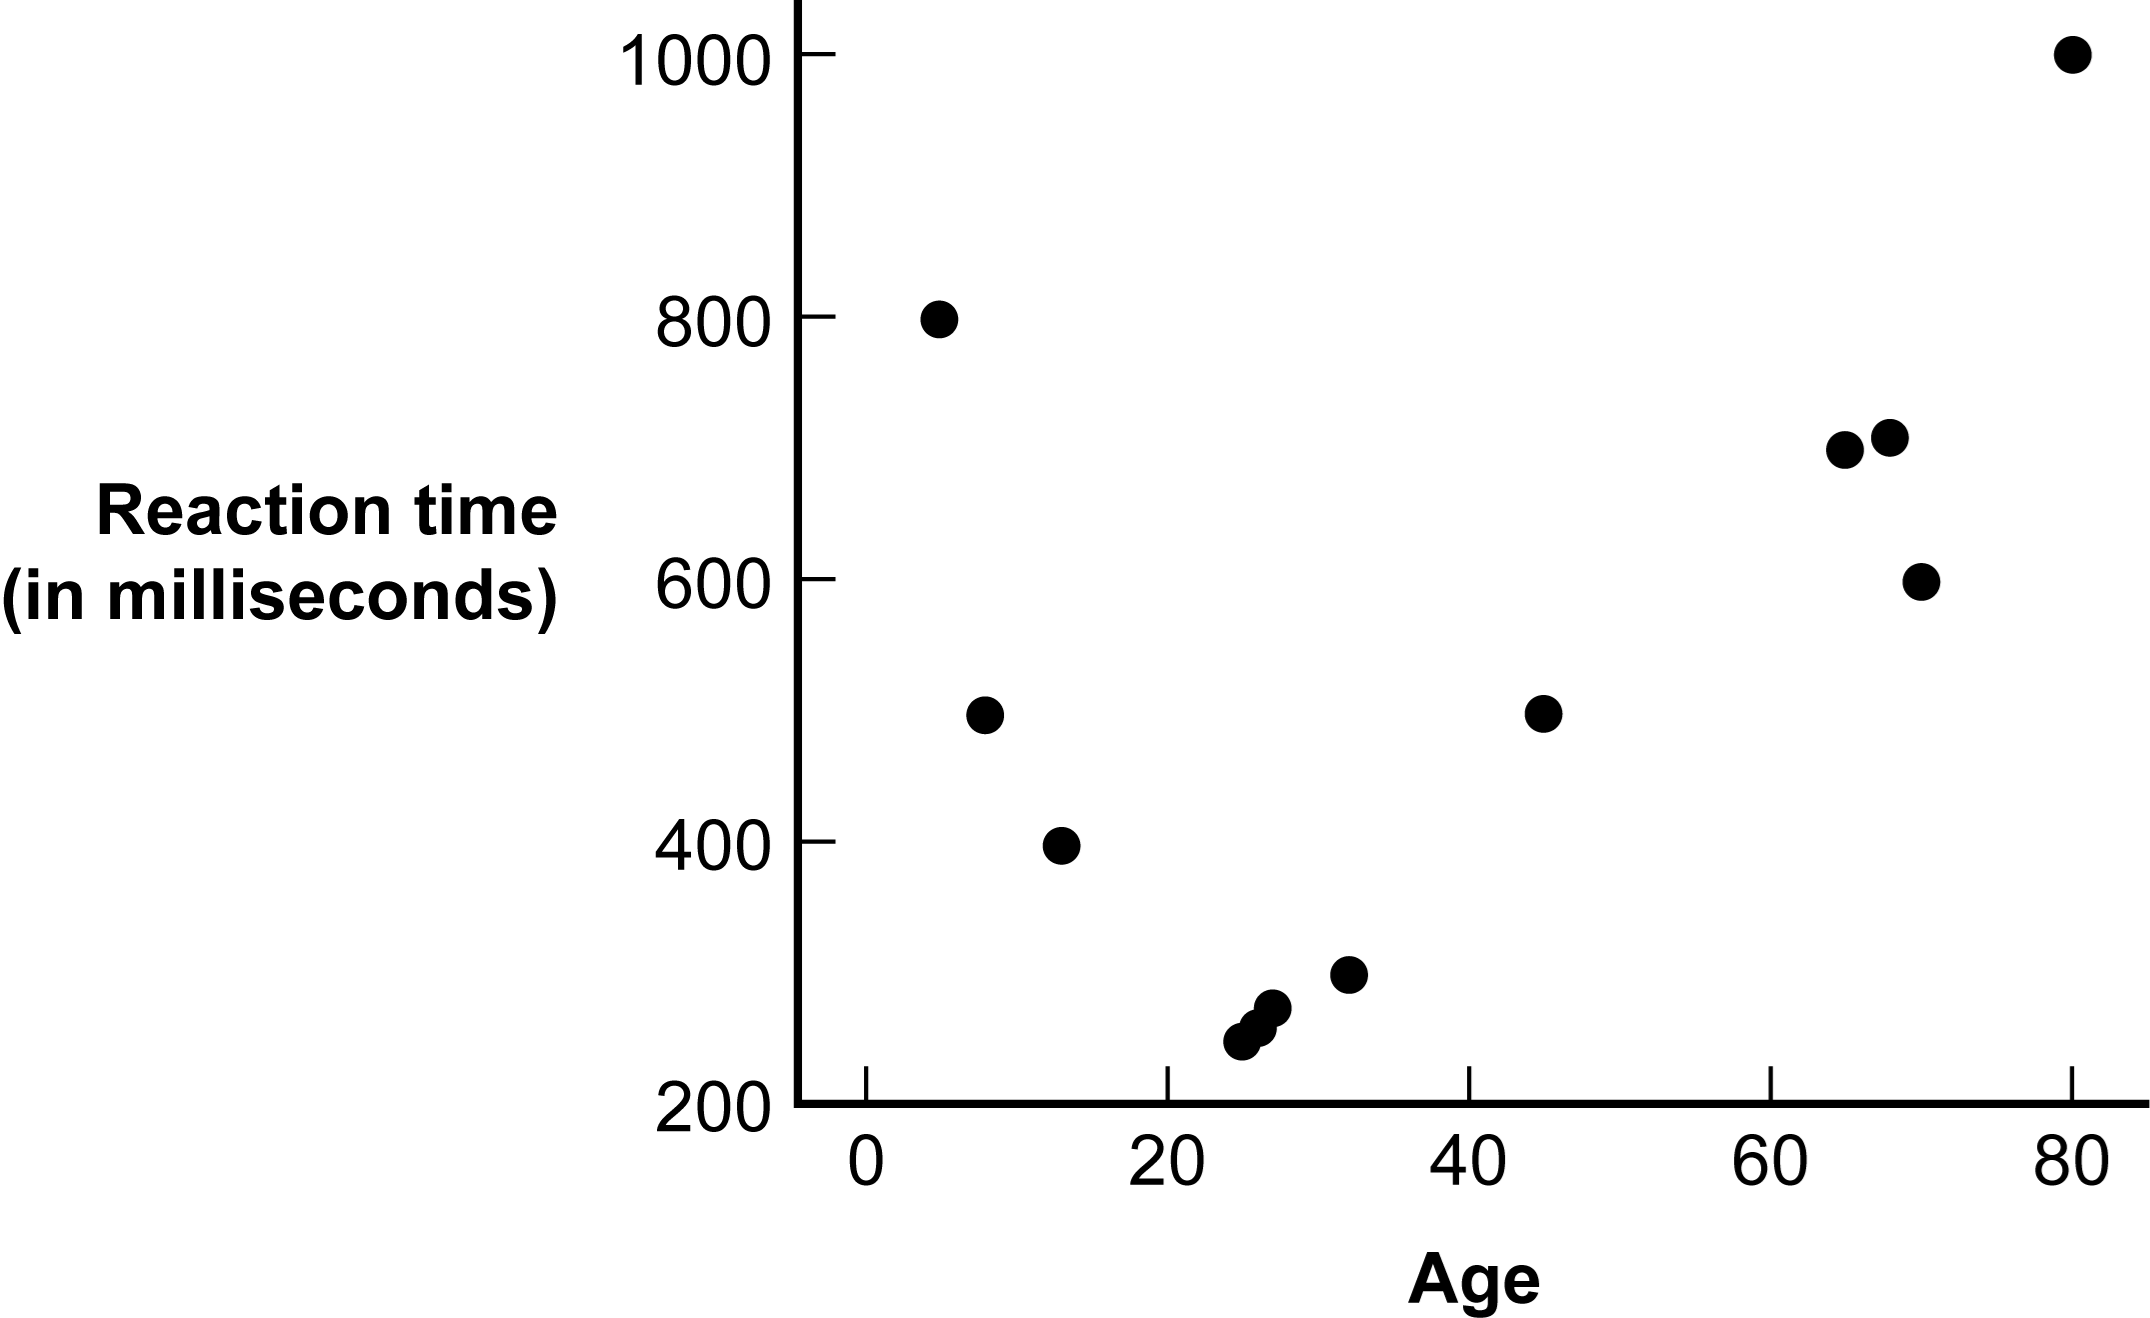 -(Figure: Age and Reaction Time) Based on the graph, what type of relation exists between age and reaction time?
(Multiple Choice)
4.9/5 (36)
Use the following to answer questions
Figure: Class Rank 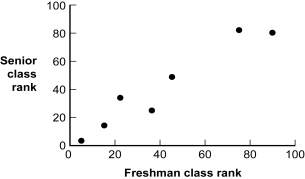 -(Figure: Class Rank) Based on this graph, what type of relation exists between freshman class rank and senior class rank?
(Multiple Choice)
4.8/5 (36)
If graphing one nominal independent variable and one scale dependent variable, use a:
(Multiple Choice)
4.8/5 (32)
When constructing a graph, it is better to make one's own, intentional decisions about its appearance than to rely on computer:
(Multiple Choice)
4.8/5 (30)
What is a potential benefit of creating a Pareto chart rather than a bar graph?
(Multiple Choice)
4.8/5 (41)
When reading a graph, one of the first questions you should ask yourself is what is being predicted, or what the _____ variable is.
(Multiple Choice)
5.0/5 (35)
A researcher was interested in measuring reaction time differences between men and women on a computerized task.What is the dependent variable?
(Multiple Choice)
5.0/5 (31)
The lie of interpolation assumes that values beyond the data points will continue indefinitely, while the lie of extrapolation assumes that some value between the data points lies on a straight line between those data points.
(True/False)
4.8/5 (28)
Filters
- Essay(0)
- Multiple Choice(0)
- Short Answer(0)
- True False(0)
- Matching(0)