Exam 3: Visual Displays of Data
Exam 1: An Introduction to Statistics and Research Design156 Questions
Exam 2: Frequency Distributions89 Questions
Exam 3: Visual Displays of Data108 Questions
Exam 4: Central Tendency and Variability108 Questions
Exam 5: Sampling and Probability145 Questions
Exam 6: The Normal Curve, Standardization and Z Scores142 Questions
Exam 7: Hypothesis Testing With Z Tests141 Questions
Exam 8: Confidence Intervals, Effect Size, and Statistical Power147 Questions
Exam 9: The Single-Sample T Test124 Questions
Exam 10: The Paired-Samples T Test101 Questions
Exam 11: The Independent-Samples T Test99 Questions
Exam 12: One-Way Between-Groups Anova108 Questions
Exam 13: One-Way Within-Groups Anova102 Questions
Exam 14: Two-Way Between-Groups Anova115 Questions
Exam 15: Correlation139 Questions
Exam 16: Regression113 Questions
Exam 17: Chi-Square Tess120 Questions
Exam 18: Choosing and Reporting Statistics105 Questions
Select questions type
If two variables are not related linearly, than they must be related nonlinearly.
(True/False)
4.9/5  (42)
(42)
A private high school wants to show that students' test scores are superior to those of another school in the district.The administration creates a bar graph showing a very tall bar representing the private school's mean test score and a very short bar representing the mean score for the other school.What part of the graph would show if the private school is exaggerating the difference between schools?
(Multiple Choice)
4.8/5 (40)
Use the following to answer questions
This figure depicts the typical relation found between a person's age (in years) and his or her reaction time in a simple reaction time task (e.g., time to press a button when a light turns green).
Figure: Age and Reaction Time 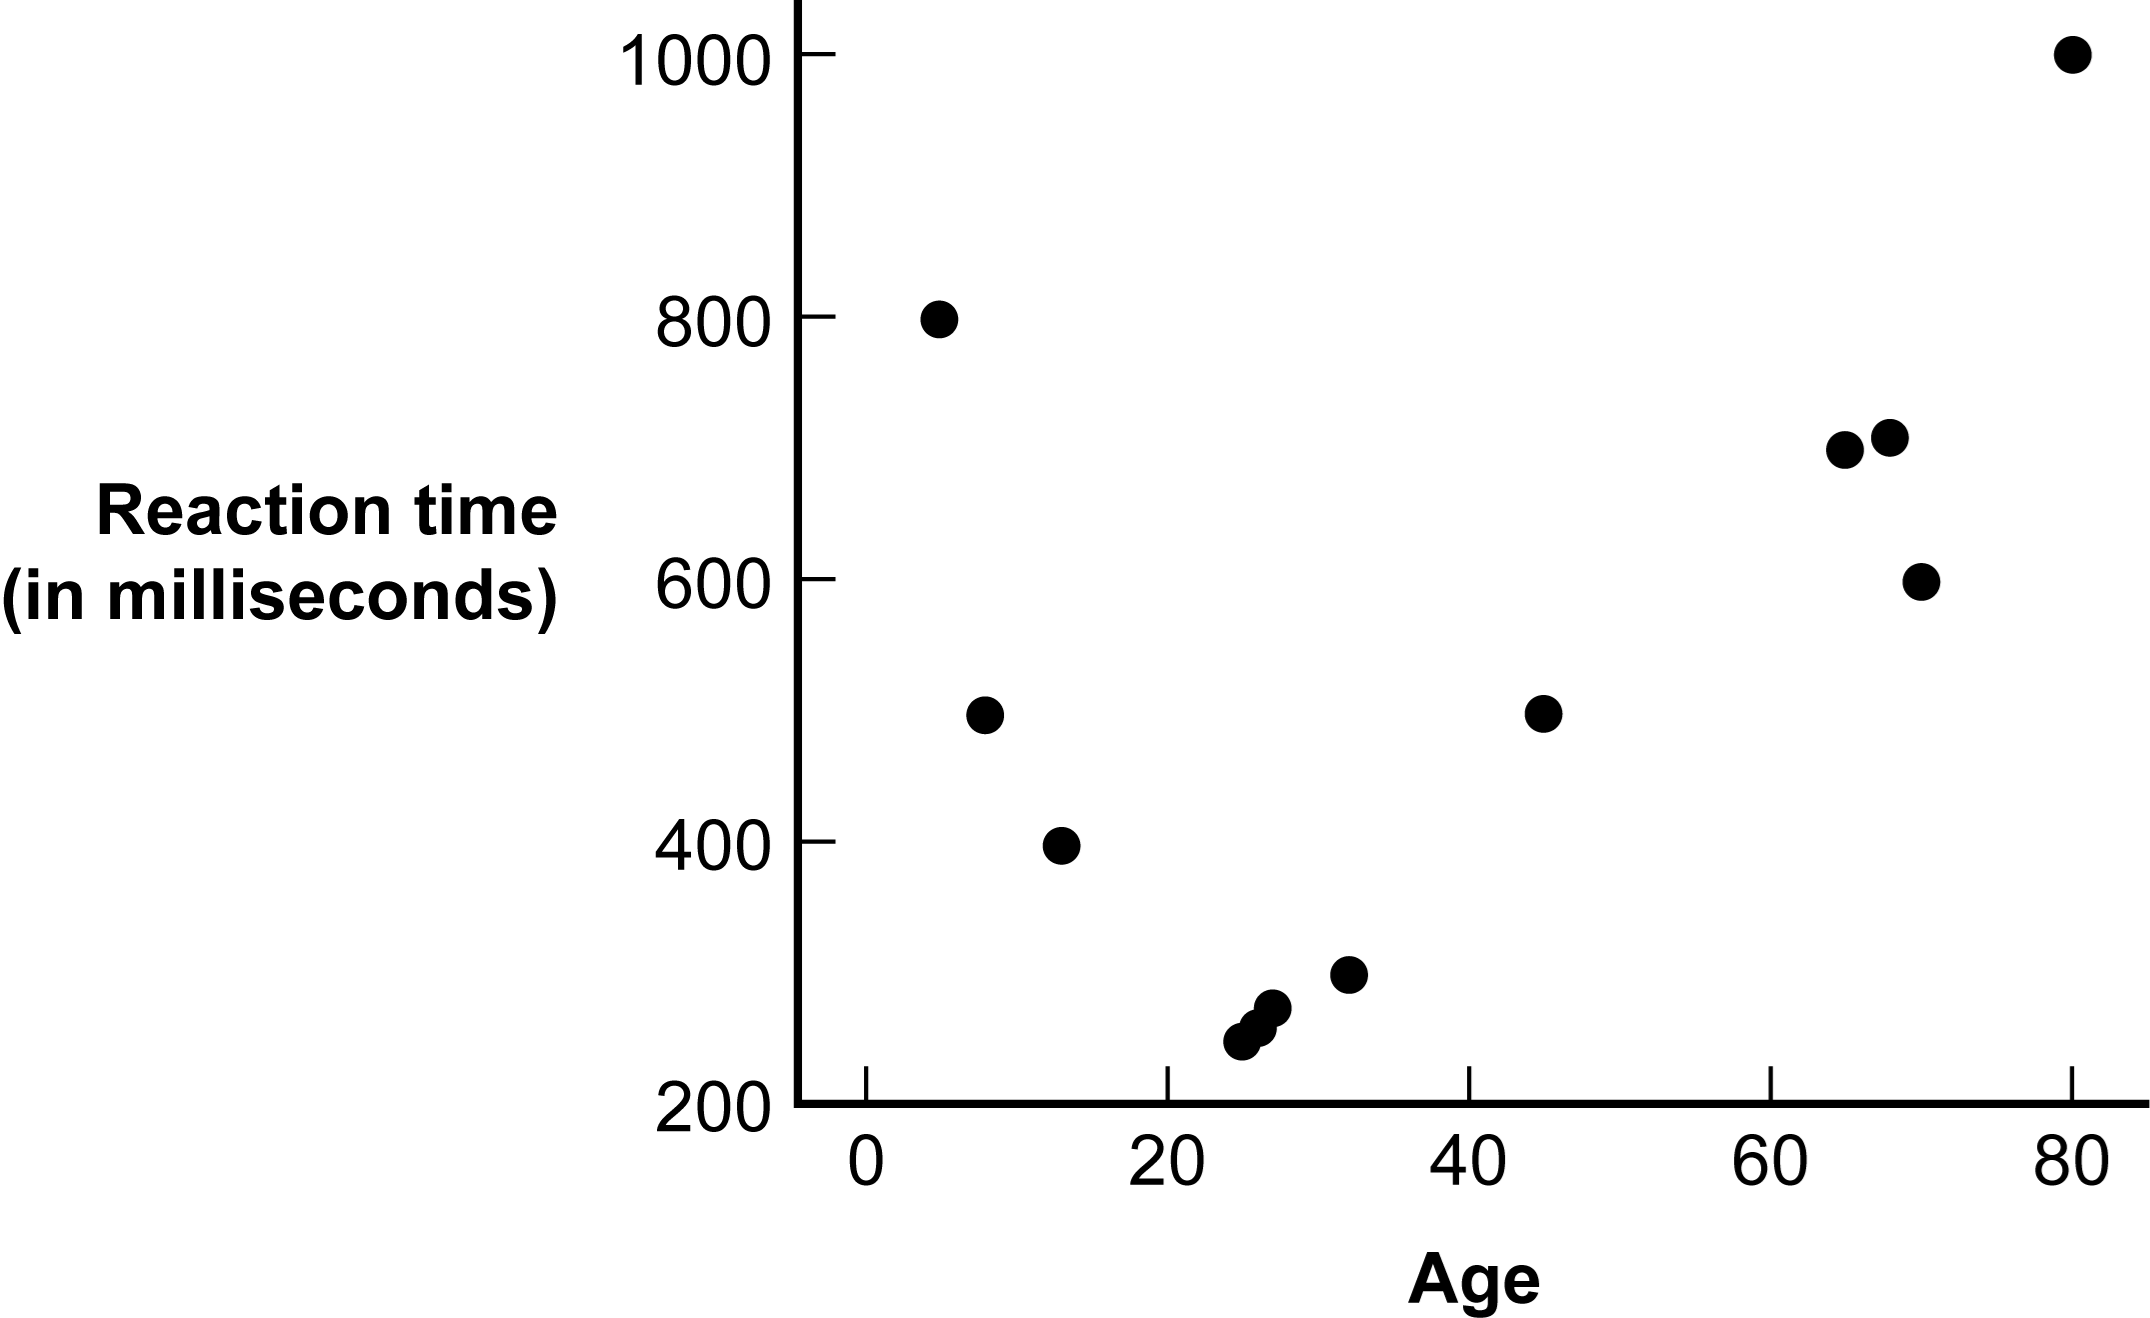 -(Figure: Age and Reaction Time) Which statement best captures what the graph depicts?
(Multiple Choice)
4.9/5 (39)
The cutesy images used to represent data in pictorial graphs could be considered an example of:
(Multiple Choice)
4.8/5 (44)
Tori wants to graph the relation between number of hours spent studying and type of major (pre-med, pre-law, and the sciences).What should be listed on the y-axis?
(Multiple Choice)
4.9/5 (36)
Bar graphs are highly informative, but they can also be deceiving because what seems to be a significant difference in means may actually be a small difference.What part of the graph reveals whether a difference in means is exaggerated?
(Multiple Choice)
4.8/5 (33)
Why are pictorial graphs typically used only in popular magazines, not in scientific journals?
(Multiple Choice)
4.8/5 (31)
On a histogram the x-axis depicts the values of a scale variable, while on a bar graph the x-axis depicts the values of _____ variable.
(Multiple Choice)
4.7/5 (29)
Use the following to answer questions
Figure: Class Rank 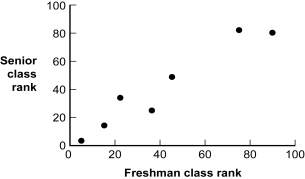 -(Figure: Class Rank) Given the construction of this graph, what is the dependent variable?
(Multiple Choice)
4.8/5 (30)
Popular magazines and Internet sources often use _____ to display information, which tend to confuse rather than clarify information.
(Multiple Choice)
4.8/5 (39)
An inaccurate values lie tells the truth in one part of the data but visually distorts it in another place.
(True/False)
4.8/5 (43)
Which of these would be appropriate to depict on a time series plot?
(Multiple Choice)
4.7/5 (42)
Use the following to answer questions
This figure depicts the results of a study by Ahluwalia et al.(2006) investigating the effects of two types of gum (placebo or nicotine) and two types of counseling (educational or motivational) in helping people to stop smoking.
Figure: Smoking Cessation 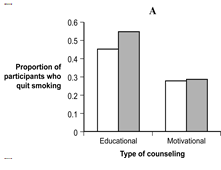
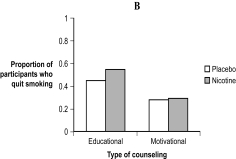 -(Figure: Smoking Cessation) Which Figure, A or B, would be the best figure to use when presenting the results of this study and why?
(Multiple Choice)
4.7/5 (35)
_____ are an efficient way to visually display data to identify whether there is a linear or nonlinear relation between scale variables.
(Multiple Choice)
4.9/5 (35)
Use the following to answer questions
Figure: Class Rank
-(Figure: Class Rank) From this graph, one knows with certainty that a person with a class rank of 60 in the freshman year would have a class rank of 60 in his or her senior year.This statement is an example of a(n) _____ lie.
(Multiple Choice)
4.8/5 (40)
When creating a bar graph, the pattern that fills in each bar is a type of moiré vibration.
(True/False)
4.8/5 (40)
A type of line graph used to depict changes in a dependent variable over time is a:
(Multiple Choice)
4.9/5 (42)
Scatterplots are often used to assess what type of pattern the data create.For example, when the data form a pattern that flows downward and toward the right, this is considered to be a(n):
(Multiple Choice)
4.8/5 (35)
Kurt is presenting data on how often owners give treats to their pets.He uses pictures of fish for cat treats and pictures of bones for dog treats in a graph of the data.Although this graph may look interesting, why should Kurt consider using a different type of graph?
(Multiple Choice)
4.8/5 (42)
A bar graph summarizing the height of buildings in a major city depicts the bars as three-dimensional skyscrapers.The appearances of the bars qualify as which type of chartjunk?
(Multiple Choice)
4.8/5 (32)
Filters
- Essay(0)
- Multiple Choice(0)
- Short Answer(0)
- True False(0)
- Matching(0)