Exam 3: Visual Displays of Data
Exam 1: An Introduction to Statistics and Research Design156 Questions
Exam 2: Frequency Distributions89 Questions
Exam 3: Visual Displays of Data108 Questions
Exam 4: Central Tendency and Variability108 Questions
Exam 5: Sampling and Probability145 Questions
Exam 6: The Normal Curve, Standardization and Z Scores142 Questions
Exam 7: Hypothesis Testing With Z Tests141 Questions
Exam 8: Confidence Intervals, Effect Size, and Statistical Power147 Questions
Exam 9: The Single-Sample T Test124 Questions
Exam 10: The Paired-Samples T Test101 Questions
Exam 11: The Independent-Samples T Test99 Questions
Exam 12: One-Way Between-Groups Anova108 Questions
Exam 13: One-Way Within-Groups Anova102 Questions
Exam 14: Two-Way Between-Groups Anova115 Questions
Exam 15: Correlation139 Questions
Exam 16: Regression113 Questions
Exam 17: Chi-Square Tess120 Questions
Exam 18: Choosing and Reporting Statistics105 Questions
Select questions type
Use the following to answer questions
This graph depicts fictional data that replicate the pattern of performance observed in a study published by Nietfeld and Ender (2003).
Figure: Intelligence and Teaching Efficacy 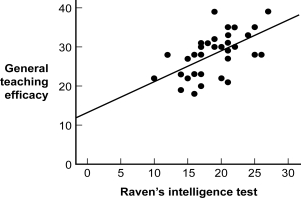 -(Figure: Intelligence and Teaching Efficacy) The type of graph depicted in the figure is a:
(Multiple Choice)
4.9/5  (42)
(42)
A researcher finds that first-year college students have a more positive outlook about their future job prospects compared to seniors who are about to graduate.The researcher infers that outlook decreases steadily with each year, including across the sophomore and junior years of college.This could represent a(n) _____ lie.
(Multiple Choice)
4.9/5 (39)
At major research institutions, the intense pressure to publish has led a few people to act desperately, creating fake data to impress their reviewers and colleagues.This faking may be demonstrated in the visual distortion of data in graphing.This is an example of a(n) _____ lie.
(Multiple Choice)
4.9/5 (40)
_____ refer(s) to any unnecessary information in a chart that is distracting.
(Multiple Choice)
4.8/5 (36)
The lie of extrapolation assumes that values beyond the data points will continue indefinitely, while the lie of interpolation assumes that some value between the data points lies on a straight line between those data points.
(True/False)
4.8/5 (34)
The purpose of a graph is to reveal and clarify relations between variables.
(True/False)
4.8/5 (28)
Filters
- Essay(0)
- Multiple Choice(0)
- Short Answer(0)
- True False(0)
- Matching(0)