Exam 11: Applications of Derivatives
Exam 1: Algebraic Concepts308 Questions
Exam 2: Linear Equations and Functions243 Questions
Exam 3: Quadratic and Other Special Functions113 Questions
Exam 4: Matrices227 Questions
Exam 5: Inequalities and Linear Programming120 Questions
Exam 6: Exponential and Logarithmic Functions108 Questions
Exam 7: Mathematics of Finance131 Questions
Exam 8: Introduction to Probability178 Questions
Exam 9: Further Topics in Probability; Data Description114 Questions
Exam 10: Derivatives248 Questions
Exam 11: Applications of Derivatives172 Questions
Exam 12: Derivatives Continued139 Questions
Exam 13: Indefinite Integrals120 Questions
Exam 14: Definite Integrals: Techniques of Integration185 Questions
Exam 15: Functions of Two or More Variables119 Questions
Select questions type
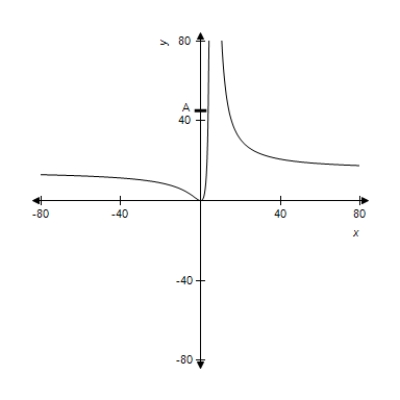
A function and its graph are given. Use the graph to find the horizontal asymptotes, if they exist, where  . Confirm your results analytically.
(Multiple Choice)
4.9/5  (35)
(35)
Suppose that the monthly cost in dollars of mining a certain ore is related to the number of pieces of equipment used, according to 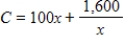 ,
,  , where x is the number of pieces of equipment used. Using how many pieces of equipment will minimize the cost?
(Multiple Choice)
4.7/5 (30)
In this problem,  and its graph are given. Use the graph of
  to determine where
  is concave up.
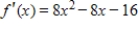
(Multiple Choice)
4.7/5 (42)
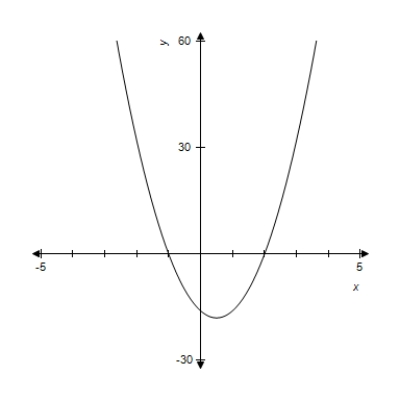
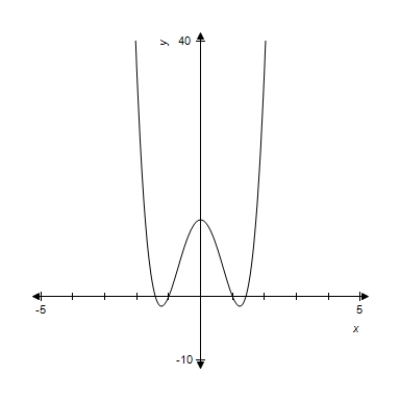
A function and its graph are given. Use the second derivative to locate all x-values of points of inflection on the graph of  . Check these results against the graph shown.
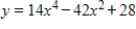
(Multiple Choice)
4.8/5 (44)
If the total revenue function for a blender is 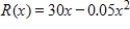 , determine how many units x must be sold to provide the maximum total revenue in dollars.
(Multiple Choice)
4.9/5 (32)
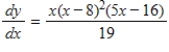
Both a function and its derivative are given. Use them to find intervals on which the function is decreasing. 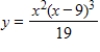
(Multiple Choice)
4.9/5 (34)
Use the indicated x-values on the graph of  to determine intervals over which the graph is concave up.
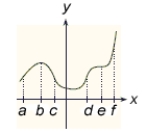
(Multiple Choice)
4.9/5 (35)
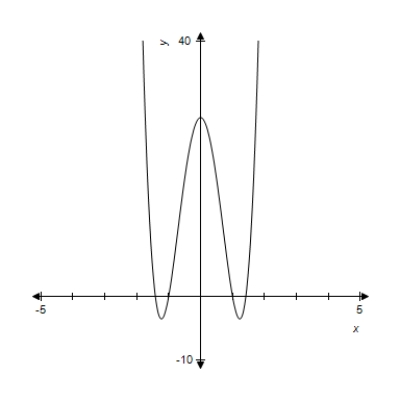
A function and its graph are given. Use the second derivative to determine intervals on which the function is concave up. Check these results against the graph shown. 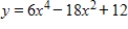
(Multiple Choice)
4.8/5 (34)
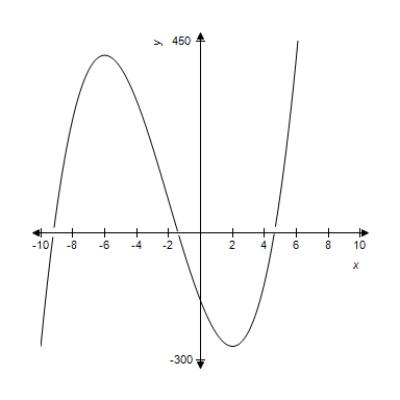
A function and its graph are given. From the graph estimate where  has a relative maximum.
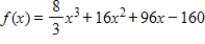
(Multiple Choice)
4.7/5 (36)
A small business has weekly average costs (in dollars) of 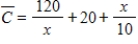 , where x is the number of units produced each week. The competitive market price for this business's product is $62 per unit. If production is limited to 430 units per week, find the maximum profit. (Note:
  )
)
(Multiple Choice)
4.7/5 (38)
Find the x-value at which the absolute maximum of f (x) occurs on the interval [a, b]. ![Find the x-value at which the absolute maximum of f (x) occurs on the interval [a, b]. ,](https://storage.examlex.com/TB1243/11eb0d3b_9867_4c17_9790_dd83ef002802_TB1243_11.jpg) ,
, ![Find the x-value at which the absolute maximum of f (x) occurs on the interval [a, b]. ,](https://storage.examlex.com/TB1243/11eb0d3b_9867_4c18_9790_65db0897a9b1_TB1243_11.jpg)
(Multiple Choice)
4.9/5 (38)
The number of milligrams x of a medication in the bloodstream t hours after a dose is taken can be modeled by  ,
,  . Find the maximum value of x. Round your answer to two decimal places.
(Multiple Choice)
4.9/5 (32)
Filters
- Essay(0)
- Multiple Choice(0)
- Short Answer(0)
- True False(0)
- Matching(0)