Exam 11: Applications of Derivatives
Exam 1: Algebraic Concepts308 Questions
Exam 2: Linear Equations and Functions243 Questions
Exam 3: Quadratic and Other Special Functions113 Questions
Exam 4: Matrices227 Questions
Exam 5: Inequalities and Linear Programming120 Questions
Exam 6: Exponential and Logarithmic Functions108 Questions
Exam 7: Mathematics of Finance131 Questions
Exam 8: Introduction to Probability178 Questions
Exam 9: Further Topics in Probability; Data Description114 Questions
Exam 10: Derivatives248 Questions
Exam 11: Applications of Derivatives172 Questions
Exam 12: Derivatives Continued139 Questions
Exam 13: Indefinite Integrals120 Questions
Exam 14: Definite Integrals: Techniques of Integration185 Questions
Exam 15: Functions of Two or More Variables119 Questions
Select questions type
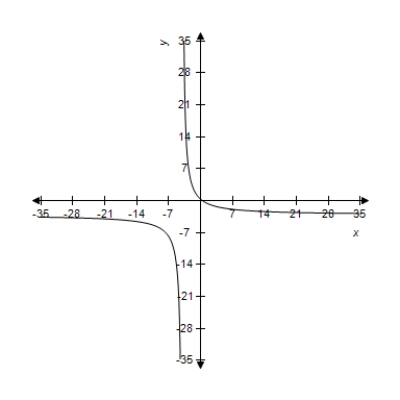
A function and its graph are given. Use the graph to find  , if it exists, where
  . Confirm your results analytically.
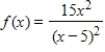
(Multiple Choice)
4.8/5  (40)
(40)
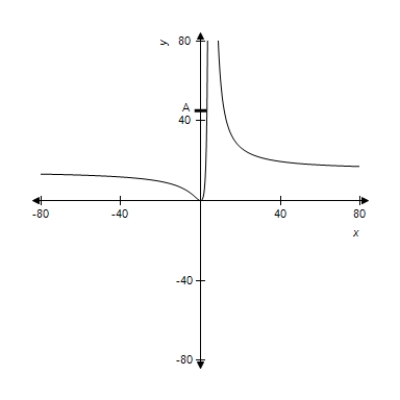
The following figure shows the growth of a population as a function of time. 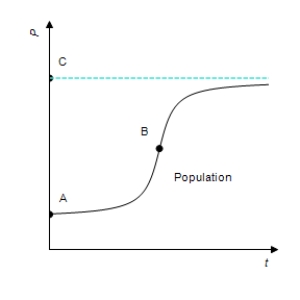 Which of A, B, and/or C correspond(s) to the upper limit of population?
(Multiple Choice)
4.8/5 (40)
A function and its graph are given. Use the graph to find  , if it exists. Confirm your results analytically.
(Multiple Choice)
4.9/5 (31)
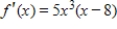
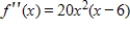
A function and its first and second derivatives are given. Use these to find all critical values. 
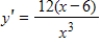
(Multiple Choice)
4.8/5 (31)
Suppose that a chain of auto service stations, Quick-Oil, Inc., has found that its monthly sales volume y (in thousands of dollars) is related to the price p (in dollars) of an oil change by 
 . Is y increasing or decreasing for all values of
(Multiple Choice)
4.7/5 (35)
For the given function, find intervals of x-values where the function is increasing. 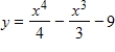
(Multiple Choice)
4.8/5 (37)
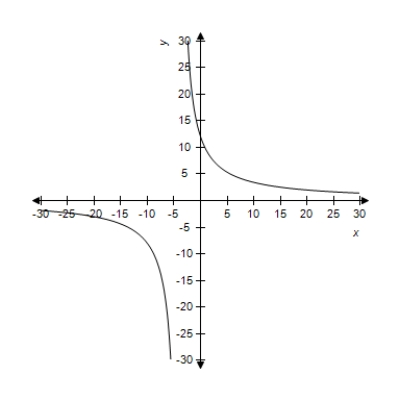
A function and its graph are given. Use the graph to estimate the locations of any vertical asymptotes. 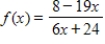
(Multiple Choice)
4.8/5 (40)
For the cost function 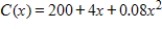 , show that average costs are minimized at the x-value where
  by finding this minimum. Round your answer to two decimal places. (Note:
  )
)
(Multiple Choice)
4.8/5 (35)
The owner of an orange grove must decide when to pick one variety of oranges. She can sell them for $14 a bushel if she sells them now, with each tree yielding an average of 5 bushels. The yield increases by half a bushel per week for the next 10 weeks, but the price per bushel decreases by $0.80 per bushel each week. When should the oranges be picked for maximum return?
(Multiple Choice)
4.9/5 (30)
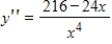
A function and its first and second derivatives are given. Use these to find the relative maxima. 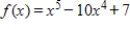
(Multiple Choice)
4.9/5 (34)
If the profit function for a commodity is 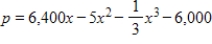 dollars, determine the number of units
  that must be sold to result in maximum profit.
(Multiple Choice)
4.9/5 (24)
A product can be produced at a total cost 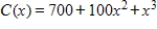 dollars, where x is the number produced. If the total revenue is given by
 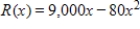 dollars, determine the level of production x that will maximize the profit.
(Multiple Choice)
4.7/5 (39)
Make a sign diagram for the function and determine all x-values at which relative minima occur. 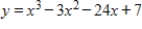
(Multiple Choice)
4.8/5 (37)
For the given function and graph, estimate the coordinates of the relative maxima by observing the graph, where  .
. 
(Multiple Choice)
4.8/5 (33)
Use the derivative to locate all critical points. Use a graphing utility if desired. Round your answers to two decimal places. 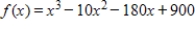
(Multiple Choice)
4.9/5 (28)
The following figure shows the growth of a population as a function of time.  If P represents the population and t represents the time, write a mathematical symbol that represents the rate of change (growth rate) of the population with respect to time.
(Multiple Choice)
4.9/5 (47)
For the given function find the relative minima, and sketch the graph. You may check your graph with a graphing utility. 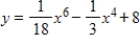
(Multiple Choice)
4.7/5 (37)
An inferior product with a large advertising budget sells well when it is introduced, but sales fall as people discontinue use of the product. Suppose that the weekly sales S are given by 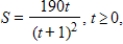 where S is in millions of dollars and t is in weeks. After how many weeks will sales be maximized?
(Multiple Choice)
4.8/5 (32)
A function and its graph are given. Use the graph to find  , if it exists. Confirm your results analytically.
(Multiple Choice)
4.9/5 (34)
Filters
- Essay(0)
- Multiple Choice(0)
- Short Answer(0)
- True False(0)
- Matching(0)