Exam 11: Applications of Derivatives
Exam 1: Algebraic Concepts308 Questions
Exam 2: Linear Equations and Functions243 Questions
Exam 3: Quadratic and Other Special Functions113 Questions
Exam 4: Matrices227 Questions
Exam 5: Inequalities and Linear Programming120 Questions
Exam 6: Exponential and Logarithmic Functions108 Questions
Exam 7: Mathematics of Finance131 Questions
Exam 8: Introduction to Probability178 Questions
Exam 9: Further Topics in Probability; Data Description114 Questions
Exam 10: Derivatives248 Questions
Exam 11: Applications of Derivatives172 Questions
Exam 12: Derivatives Continued139 Questions
Exam 13: Indefinite Integrals120 Questions
Exam 14: Definite Integrals: Techniques of Integration185 Questions
Exam 15: Functions of Two or More Variables119 Questions
Select questions type
Suppose the average costs of a mining operation depend on the number of machines used, and average costs, in dollars, are given by 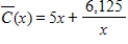 ,
,  , where x is the number of machines used. Over what interval in the domain do average costs decrease?
(Multiple Choice)
4.9/5  (45)
(45)
The manufacturer of GRIPPER tires modeled its return to sales from television advertising expenditures in two regions, as follows: Region1: 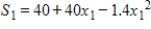 Region2:
 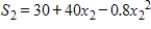 where
where  and
and  are the sales revenue in millions of dollars, and
  and
and  are millions of dollars of expenditures for television advertising. How much money will be needed to maximize sales revenue in both districts? Round your answer to the nearest million dollars.
(Multiple Choice)
4.9/5 (33)
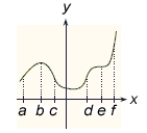
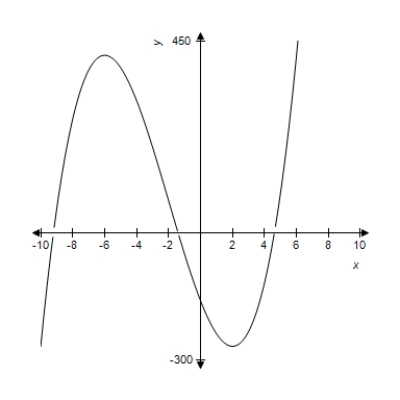
For the given function, use the graph to identify x-values for which  . You may use the derivative to check your conclusion.
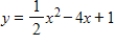
(Multiple Choice)
4.8/5 (45)
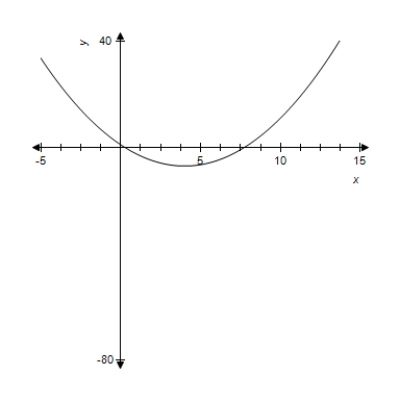
A firm can produce 100 units per week. If its total cost function is 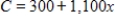 dollars, and its total revenue function is
  dollars, find the maximum profit.
(Multiple Choice)
4.9/5 (45)
A company needs 300 items per year. Production costs are $70 to prepare for a production run and $6 for each item produced. Inventory costs are $0.75 per item per year. Find the number of items that should be produced in each run so that the total costs of production and storage are minimized.
(Multiple Choice)
4.8/5 (40)
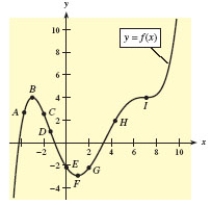
Use the graph shown in the figure and identify points from A through I that satisfy the given condition.  and
and 

(Multiple Choice)
4.8/5 (41)
For the given function and graph, estimate the coordinates of the relative minima by observing the graph, where  .
. 
(Multiple Choice)
4.9/5 (41)
A vacationer on an island 8 miles offshore from a point that is 48 miles from a town to which the vacationer must travel occasionally. (See the figure.) The vacationer has a boat capable of traveling 30 mph and can go by auto along the coast at 55 mph. At what distance x from the point on shore closest to the vacationer on the island should the boat be left to minimize the time it takes to get to town? Round your answer to one decimal place. 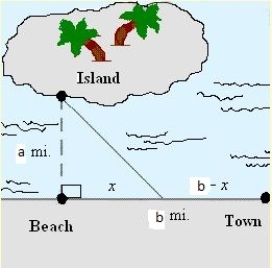 Where
Where  ,
, 
(Multiple Choice)
4.9/5 (35)
Analytically determine the location(s) of any vertical asymptote(s). Round your answer to two decimal places. 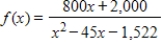
(Multiple Choice)
4.8/5 (33)
A travel agency will plan a tour for groups of size 8 or larger. If the group contains exactly 8 people, the price is $800 per person. However, each person's price is reduced by $10 for each additional person above the 8. If the travel agency incurs a price of $100 per person for the tour, what size group will give the agency the maximum profit?
(Multiple Choice)
4.8/5 (29)
Suppose the average costs of a mining operation depend on the number of machines used, and average costs, in dollars, are given by 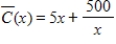 ,
,  , where x is the number of machines used. Find the critical values of
  that lie in the domain of the problem.
(Multiple Choice)
4.9/5 (38)
Use the indicated  -values on the graph of
  to find all the intervals where
  .
. 
(Multiple Choice)
4.8/5 (40)
The profit function for a commodity is 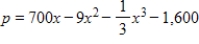 dollars. Find the maximum profit. Round your answer to the nearest dollar.
(Multiple Choice)
4.7/5 (39)
For the given function, find the horizontal points of inflection. 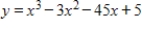
(Multiple Choice)
4.8/5 (42)
Use the graph shown in the figure and identify points from A through I that satisfy the given condition.  and
and 
(Multiple Choice)
5.0/5 (42)
The following figure shows the graph of revenue function  and cost function
  . At which of the four x-values shown is the slope of the tangent to the revenue curve equal to the slope of the tangent to the cost curve?
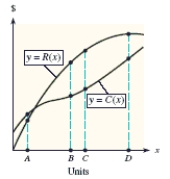
(Multiple Choice)
4.8/5 (40)
A function and its graph are given. From the graph estimate where  has a relative minimum.
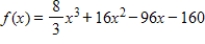
(Multiple Choice)
4.8/5 (39)
Analytically determine the location of any vertical asymptotes. Round your answer to two decimal places. 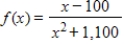
(Multiple Choice)
4.9/5 (38)
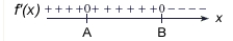
Use the sign diagram for  to determine the largest interval on which f (x) increases, where
  and
and  .
. 
(Multiple Choice)
5.0/5 (37)
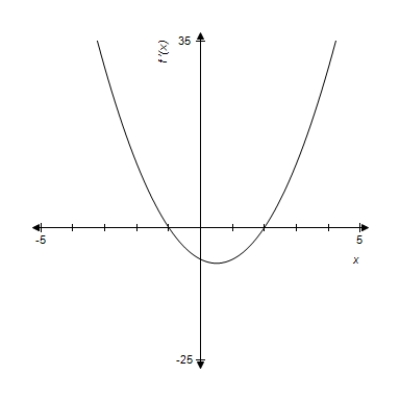
A graph of  is given. Use the graph to determine where f (x) is decreasing.
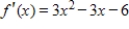
(Multiple Choice)
4.8/5 (39)
Filters
- Essay(0)
- Multiple Choice(0)
- Short Answer(0)
- True False(0)
- Matching(0)