Exam 11: Applications of Derivatives
Exam 1: Algebraic Concepts308 Questions
Exam 2: Linear Equations and Functions243 Questions
Exam 3: Quadratic and Other Special Functions113 Questions
Exam 4: Matrices227 Questions
Exam 5: Inequalities and Linear Programming120 Questions
Exam 6: Exponential and Logarithmic Functions108 Questions
Exam 7: Mathematics of Finance131 Questions
Exam 8: Introduction to Probability178 Questions
Exam 9: Further Topics in Probability; Data Description114 Questions
Exam 10: Derivatives248 Questions
Exam 11: Applications of Derivatives172 Questions
Exam 12: Derivatives Continued139 Questions
Exam 13: Indefinite Integrals120 Questions
Exam 14: Definite Integrals: Techniques of Integration185 Questions
Exam 15: Functions of Two or More Variables119 Questions
Select questions type
If the total cost function for a product is 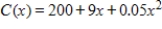 dollars, determine how many units x should be produced to minimize the average cost per unit?
(Multiple Choice)
4.8/5  (41)
(41)
The consumer price data can be modeled by the function 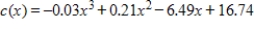 , where
  represents 1945 and
  is the consumer price index (CPI) in year
  . During what year does the model predict that the rate of change of the CPI reached its maximum?
(Multiple Choice)
4.9/5 (32)
In this problem,  and its graph are given. Use the graph of
  to determine where
  has a point of inflection.
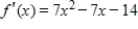
(Multiple Choice)
4.9/5 (40)
For the revenue function given by 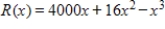 , find the x-value where
  that is, where the average revenue equals the marginal revenue. (Note:
  )
)
(Multiple Choice)
4.8/5 (39)
For the revenue function given by 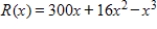 find the maximum average revenue.
(Multiple Choice)
4.8/5 (31)
The following figure shows the graph of revenue function  and cost function
  . At which of the four
  -values shown is the profit largest?
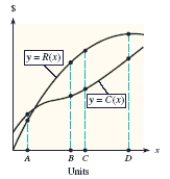
(Multiple Choice)
4.9/5 (30)
From a tract of land, a developer plans to fence a rectangular region and then divide it into two identical rectangular lots by putting a fence down the middle. Suppose that the fence for the outside boundary costs $6 per foot and the fence for the middle costs $4 per foot. If each lot contains 4,600 square feet, find the dimensions of each lot that yield the minimum cost for the fence. Round your answer to two decimal places.
(Multiple Choice)
4.9/5 (41)
A firm can produce 100 units per week. If its total cost function is  dollars, and its total revenue function is
 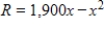 dollars, how many units x should it produce to maximize its profit?
(Multiple Choice)
4.9/5 (41)
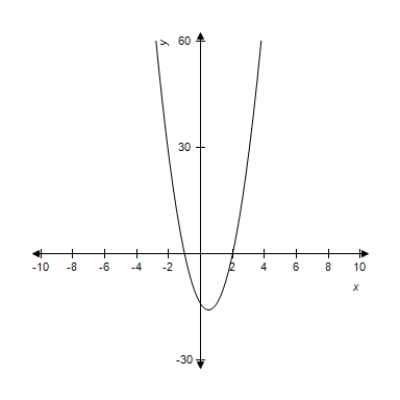
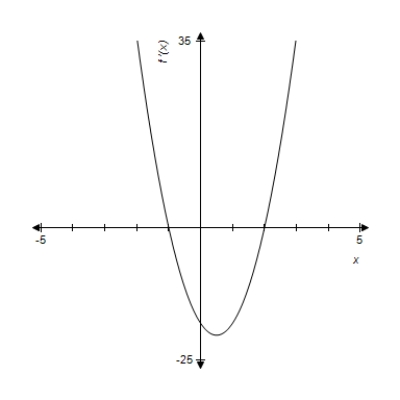
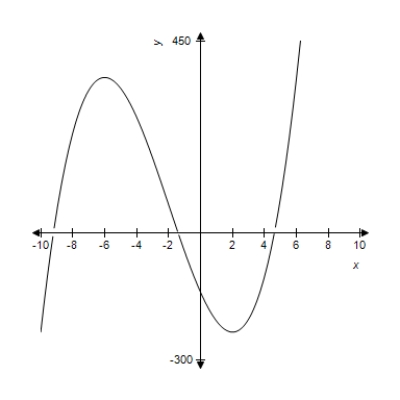
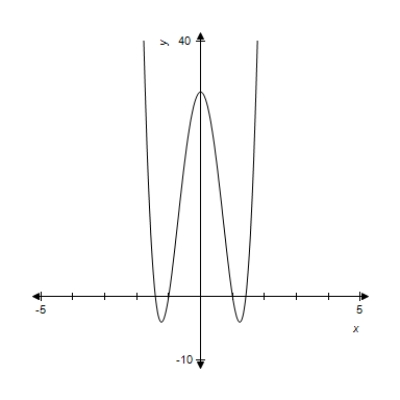
A graph of  is given. Use the graph to determine where the graph of
  has a relative minimum.
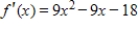
(Multiple Choice)
4.8/5 (35)
A function and its graph are given. From the graph, estimate where  .
. 
(Multiple Choice)
4.8/5 (43)
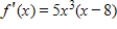
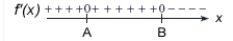
Use the sign diagram for  to determine all critical values of f (x), where
  and
and  .
. 
(Multiple Choice)
4.7/5 (29)
For the given function, find all intervals of x-values where the function is decreasing. 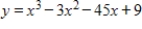
(Multiple Choice)
4.7/5 (39)
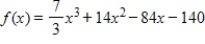
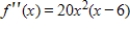
A function and its first and second derivatives are given. Use these to find all points of inflection. 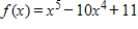
(Multiple Choice)
4.9/5 (42)
Use the sign diagram for  to determine x-values at which relative maxima occur, where
  and
and  .
. 
(Multiple Choice)
4.9/5 (36)
A function and its graph are given. Use the second derivative to determine intervals on which the function is concave down. Check these results against the graph shown. 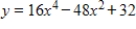
(Multiple Choice)
4.7/5 (36)
The profit from a grove of orange trees is given by  dollars, where x is the number of orange trees per acre. How many trees per acre will maximize the profit?
(Multiple Choice)
4.8/5 (31)
Use the sign diagram for  to determine x-values at which relative minima occur, where
  and
and  .
. 
(Multiple Choice)
4.8/5 (38)
The percent  of impurities that can be removed from the waste water of a manufacturing process at a cost of
  dollars is given by
  . Find
  values for which p is increasing.
(Multiple Choice)
5.0/5 (28)
Filters
- Essay(0)
- Multiple Choice(0)
- Short Answer(0)
- True False(0)
- Matching(0)