Exam 19: Multiple Regression
Exam 1: What Is Statistics14 Questions
Exam 2: Types of Data, Data Collection and Sampling16 Questions
Exam 3: Graphical Descriptive Methods Nominal Data19 Questions
Exam 4: Graphical Descriptive Techniques Numerical Data64 Questions
Exam 5: Numerical Descriptive Measures147 Questions
Exam 6: Probability106 Questions
Exam 7: Random Variables and Discrete Probability Distributions55 Questions
Exam 8: Continuous Probability Distributions117 Questions
Exam 9: Statistical Inference: Introduction8 Questions
Exam 10: Sampling Distributions65 Questions
Exam 11: Estimation: Describing a Single Population127 Questions
Exam 12: Estimation: Comparing Two Populations22 Questions
Exam 13: Hypothesis Testing: Describing a Single Population129 Questions
Exam 14: Hypothesis Testing: Comparing Two Populations78 Questions
Exam 15: Inference About Population Variances49 Questions
Exam 16: Analysis of Variance115 Questions
Exam 17: Additional Tests for Nominal Data: Chi-Squared Tests110 Questions
Exam 18: Simple Linear Regression and Correlation213 Questions
Exam 19: Multiple Regression121 Questions
Exam 20: Model Building92 Questions
Exam 21: Nonparametric Techniques126 Questions
Exam 22: Statistical Inference: Conclusion103 Questions
Exam 23: Time-Series Analysis and Forecasting145 Questions
Exam 24: Index Numbers25 Questions
Exam 25: Decision Analysis51 Questions
Select questions type
In multiple regression analysis involving 9 independent variables and 110 observations, the critical value of t for testing individual coefficients in the model will have:
(Multiple Choice)
4.9/5  (40)
(40)
If none of the data points for a multiple regression model with two independent variables were on the regression plane, then the multiple coefficient of determination would be:
(Multiple Choice)
4.8/5 (35)
A statistics professor investigated some of the factors that affect an individual student's final grade in his or her course. He proposed the multiple regression model: .
Where:
y = final mark (out of 100). = number of lectures skipped. = number of late assignments. = mid-term test mark (out of 100).
The professor recorded the data for 50 randomly selected students. The computer output is shown below. THE REGRESSION EQUATION IS
 Predictor Coef StDev T Constant 41.6 17.8 2.337 -3.18 1.66 -1.916 -1.17 1.13 -1.035 0.63 0.13 4.846
ANALYSIS OF VARIANCE
Source of Variation Regression 3 3716 1238.667 6.558 Error 46 8688 188.870 Total 49 12404
What is the coefficient of determination? What does this statistic tell you?
Predictor Coef StDev T Constant 41.6 17.8 2.337 -3.18 1.66 -1.916 -1.17 1.13 -1.035 0.63 0.13 4.846
ANALYSIS OF VARIANCE
Source of Variation Regression 3 3716 1238.667 6.558 Error 46 8688 188.870 Total 49 12404
What is the coefficient of determination? What does this statistic tell you?
(Essay)
4.9/5 (33)
In a multiple regression model, the following statistics are given: SSE = 100, , k = 5, n = 15.
The multiple coefficient of determination adjusted for degrees of freedom is:
(Multiple Choice)
5.0/5 (34)
The graphical depiction of the equation of a multiple regression model with k independent variables (k > 1) is referred to as:
(Multiple Choice)
4.8/5 (37)
Which of the following best describes the Durbin-Watson test?
(Multiple Choice)
4.9/5 (33)
Pop-up coffee vendors have been popular in the city of Adelaide in 2013. A vendor is interested in knowing how temperature (in degrees Celsius) and number of different pastries and biscuits offered to customers impacts daily hot coffee sales revenue (in $00's).
A random sample of 6 days was taken, with the daily hot coffee sales revenue and the corresponding temperature and number of different pastries and biscuits offered on that day, noted.
Excel output for a multiple linear regression is given below: Coffee sales revenue Temperature Pastries/biscuits 6.5 25 7 10 17 13 5.5 30 5 4.5 35 6 3.5 40 3 28 9 15 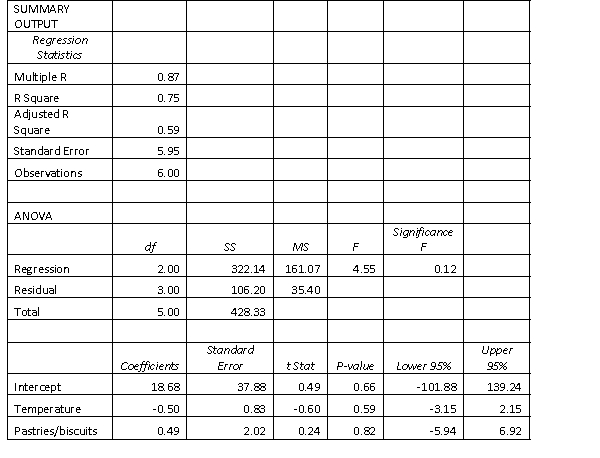 Comment on the difference between the coefficient of determination and the Adjusted coefficient of determination.
(Essay)
4.9/5 (37)
In a multiple regression analysis involving k independent variables and n data points, the number of degrees of freedom associated with the sum of squares for regression is:
(Multiple Choice)
4.8/5 (37)
Test the hypotheses: There is no first-order autocorrelation There is negative first-order autocorrelation,
given that the Durbin-Watson statistic d = 2.50, n = 40, k = 3 and 0.05.
(Essay)
4.8/5 (35)
An actuary wanted to develop a model to predict how long individuals will live. After consulting a number of physicians, she collected the age at death (y), the average number of hours of exercise per week ( ), the cholesterol level ( ), and the number of points by which the individual's blood pressure exceeded the recommended value ( ). A random sample of 40 individuals was selected. The computer output of the multiple regression model is shown below:
THE REGRESSION EQUATION IS Predictor Coef StDev T Constant 55.8 11.8 4.729 1.79 0.44 4.068 -0.021 0.011 -1.909 -0.016 0.014 -1.143 S = 9.47 R-Sq = 22.5%. ANALYSIS OF VARIANCE Source of Variation df SS MS F Regression 3 936 312 3.477 Error 36 3230 89.722 Total 39 4166 Is there enough evidence at the 5% significance level to infer that the cholesterol level and the age at death are negatively linearly related?
(Essay)
4.9/5 (39)
In regression analysis, the total variation in the dependent variable y, measured by , can be decomposed into two parts: the explained variation, measured by SSR, and the unexplained variation, measured by SSE.
(True/False)
4.9/5 (40)
In a regression model involving 30 observations, the following estimated regression model was obtained:  . For this model, total variation in y = SSY = 800 and SSE = 200. The value of the F-statistic for testing the validity of this model is:
(Multiple Choice)
4.9/5 (32)
In a multiple regression, a large value of the test statistic F indicates that most of the variation in y is explained by the regression equation, and that the model is useful; while a small value of F indicates that most of the variation in y is unexplained by the regression equation, and that the model is useless.
(True/False)
4.9/5 (41)
A multiple regression analysis involving 3 independent variables and 25 data points results in a value of 0.769 for the unadjusted multiple coefficient of determination. The adjusted multiple coefficient of determination is:
(Multiple Choice)
4.8/5 (37)
In multiple regression, when the response surface (the graphical depiction of the regression equation) hits every single point, the sum of squares for error SSE = 0, the standard error of estimate = 0, and the coefficient of determination = 1.
(True/False)
4.9/5 (40)
In a multiple regression analysis, when there is no linear relationship between each of the independent variables and the dependent variable, then:
(Multiple Choice)
4.8/5 (37)
In a multiple regression analysis involving 4 independent variables and 30 data points, the number of degrees of freedom associated with the sum of squares for error, SSE, is 25.
(True/False)
4.7/5 (35)
A multiple regression equation includes 5 independent variables, and the coefficient of determination is 0.64. The percentage of the variation in y that is explained by the regression equation is:
(Multiple Choice)
4.8/5 (33)
A statistician wanted to determine whether the demographic variables of age, education and income influence the number of hours of television watched per week. A random sample of 25 adults was selected to estimate the multiple regression model .
Where:
y = number of hours of television watched last week. = age. = number of years of education. = income (in $1000s).
The computer output is shown below.
THE REGRESSION EQUATION IS Predictor Coef StDev Constant 22.3 10.7 2.084 0.41 0.19 2.158 -0.29 0.13 -2.231 -0.12 0.03 -4.00 S = 4.51 R-Sq = 34.8%. ANALYSIS OF VARIANCE Source of Variation df SS MS F Regression 3 227 75.667 3.730 Error 21 426 20.286 Total 24 653 Is there sufficient evidence at the 1% significance level to indicate that hours of television watched and education are negatively linearly related?
(Essay)
4.7/5 (33)
Filters
- Essay(0)
- Multiple Choice(0)
- Short Answer(0)
- True False(0)
- Matching(0)