Exam 9: Estimation Using a Single Sample
Exam 1: The Role of Statistics and the Data Analysis Process17 Questions
Exam 2: Collecting Data Sensibly39 Questions
Exam 3: Graphical Methods for Describing Data25 Questions
Exam 4: Numerical Methods for Describing Data26 Questions
Exam 5: Summarizing Bivariate Data37 Questions
Exam 6: Probability34 Questions
Exam 7: Random Variables and Probability Distributions45 Questions
Exam 8: Sampling Variability and Sampling Distributions27 Questions
Exam 9: Estimation Using a Single Sample46 Questions
Exam 10: Hypothesis Testing Using a Single Sample37 Questions
Exam 11: Comparing Two Populations or Treatments42 Questions
Exam 12: The Analysis of Categorical Data and Goodness-Of-Fit Tests21 Questions
Exam 13: Simple Linear Regression and Correlation: Inferential Methods56 Questions
Exam 14: Multiple Regression Analysis38 Questions
Exam 15: Analysis of Variance40 Questions
Exam 16: Nonparametric Distribution-Free Statistical Methods15 Questions
Select questions type
At Abraham Lincoln High School a popular achievement test is used for college placement. Counselors selected a random sample of 100 students from Abraham Lincoln High School and scored their tests by hand before sending them in for computer processing. For this sample,  and s = 25. Construct a 99% confidence interval for μ, the population mean score for Abraham Lincoln High.
(Essay)
4.8/5  (32)
(32)
A recent study investigated the effects of a "Buckle Up Your Toddlers" campaign to get parents to use the grocery cart seat belts. Investigators observed a simple random sample of parents in a large city, and found 192 out of 594 parents buckling up their toddlers.
a) Compute a point estimate of the true proportion of all parents who buckle up their toddlers.
b) Construct and interpret a 95% confidence interval for π, the true proportion of all parents who buckle up their toddlers.
(Essay)
4.9/5 (34)
The conclusion "We can be 95% confident that between 68% and 85% of people in this town prefer e-books to paper books" is the interpretation of
(Multiple Choice)
4.9/5 (34)
What is the difference between an unbiased statistic and a biased statistic?
(Essay)
4.8/5 (35)
Since s2 gives an unbiased estimate of σ2, s gives an unbiased estimate of σ.
(True/False)
4.8/5 (35)
Eyestrain is thought to be associated with different types of office work. The Acme Temp-Help Company provides short-term employees to substitute for vacationing data entry personnel. Previous research has shown that approximately 21% of full time data entry personnel have eyestrain, and Acme would like to estimate the proportion, π, of their 6,000 part-time data entry employees that have eyestrain.
a) They would like to estimate π to within 0.05 with 95% confidence. If they accept the starting value of 0.21 as a reasonable initial estimate of π, what sample size should they use for their study?
b) Suppose Acme had felt that the working conditions of their temporary data entry personnel were different enough that they should not depend on the 0.21 as an initial estimate. In a few sentences, explain how your procedure for choosing a samples size would differ from your solution in part (a). (Do NOT recalculate a new estimate of the necessary sample size!)
(Essay)
4.9/5 (27)
A t curve is bell-shaped like the z curve but is less spread out.
(True/False)
4.9/5 (40)
If the distribution of a population is symmetric, both the mean and median give unbiased estimates of the population mean. What criteria would you consider in choosing which statistic to use if you wanted to estimate the population mean?
(Essay)
4.8/5 (46)
For a 95% confidence level, using the boundaries that capture the middle 95% of the bootstrap distribution is equivalent to getting a value for  minus a number, and for
  plus a number. The numbers subtracted and added won't be the same since the bootstrap distribution would not be symmetric.
(True/False)
4.9/5 (33)
Suppose that a newspaper conducts a survey of a random sample of 120 registered voters in order to predict the winner of a local election. The Republican candidate was favored by 62 of the respondents.
a) Construct and interpret a 99% CI for the true proportion of voters who prefer the Republican candidate.
b) If a candidate needs a simple majority of the votes to win the election, can the Republican candidate be confident of victory? Justify your response with an appropriate statistical argument.
(Essay)
4.8/5 (25)
Would it be appropriate to use a bootstrap confidence interval for the given distribution of a sample mean? 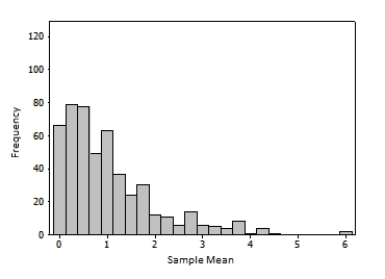
(True/False)
4.8/5 (29)
The t confidence interval formula for estimating μ should only be used when the population being sampled is at least approximately normally distributed.
(True/False)
4.8/5 (31)
An understanding of bird's choices of habitat is a crucial element in understanding avian biology and ecology. One aspect of habitat choice is the pattern of their preferred vertical height when feeding in forests. In a study of small birds in an old-growth forest in the Pacific Northwest, researchers (suspended from a giant crane!) observed the landings of Golden-crowned kinglets (Regulus strapa). They found that 78 of the 163 landings were in the "mid" height region, 21-40 meters above ground.
a) Compute a point estimate of the population proportion of all landings of these kinglets that are in the 21 - 40 meter height range.
b) Construct and interpret a 95% confidence interval for π, the population proportion of all landings of these kinglets that are in the 21 - 40 meter height range.
(Essay)
4.8/5 (34)
One indicator of the health of field mice is the length of their tails. The following data were gathered on a random sample of field mice. A University biologist would like to construct a 95% confidence interval for the population mean tail length of the field mice near Fairfield. (Measures are in mm). 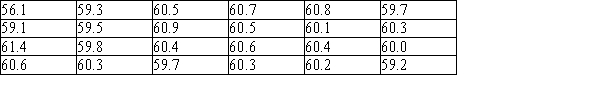 a) Using a graphical display of your choice, display the data in a way that will allow you to determine whether it would be appropriate to use a 95% t confidence interval to estimate the population mean.
b) Using the graphical display from part (a), would you advise that constructing a 95% confidence interval is appropriate? Provide statistical justification for your answer.
a) Using a graphical display of your choice, display the data in a way that will allow you to determine whether it would be appropriate to use a 95% t confidence interval to estimate the population mean.
b) Using the graphical display from part (a), would you advise that constructing a 95% confidence interval is appropriate? Provide statistical justification for your answer.
(Essay)
4.9/5 (25)
When the sample size is "large enough," the statistic p has an approximately normal sampling distribution. How does one determine if a sample size is large enough?
(Essay)
4.9/5 (32)
The large sample confidence interval formula for estimating π can always safely be used if n ≥ 30.
(True/False)
4.9/5 (38)
Using an unbiased statistic guarantees that there will be no systematic tendency to under- or overestimate the value of the population characteristic and that estimates will almost always be relatively close to the true value.
(True/False)
4.7/5 (34)
Bicycle crashes are a common cause of severe injuries in childhood. A researcher theorized that this might be because of inadequate "gap" time (the time between a bicycling child clearing an intersection and the subsequent entry of an oncoming car into that intersection). A researcher experimentally investigated the gap judgments of 10-year-olds by placing them in a computer-generated virtual environment of cars approaching an intersection at 25 mph. The following gap times were observed for ten randomly selected children: 6.72, 4.18, 2.32, 4.05, 8.39, 5.44, 6.24, 2.05, 3.29, 5.38
a) Use the given data to produce a point estimate of μ, the population mean gap time of 10-year-olds from this population.
b) Use the given data to produce an unbiased point estimate of σ2, the population variance of the gap time of 10-year-olds from this population.
(Essay)
4.8/5 (29)
Filters
- Essay(0)
- Multiple Choice(0)
- Short Answer(0)
- True False(0)
- Matching(0)