Exam 8: Sampling Variability and Sampling Distributions
Exam 1: The Role of Statistics and the Data Analysis Process17 Questions
Exam 2: Collecting Data Sensibly39 Questions
Exam 3: Graphical Methods for Describing Data25 Questions
Exam 4: Numerical Methods for Describing Data26 Questions
Exam 5: Summarizing Bivariate Data37 Questions
Exam 6: Probability34 Questions
Exam 7: Random Variables and Probability Distributions45 Questions
Exam 8: Sampling Variability and Sampling Distributions27 Questions
Exam 9: Estimation Using a Single Sample46 Questions
Exam 10: Hypothesis Testing Using a Single Sample37 Questions
Exam 11: Comparing Two Populations or Treatments42 Questions
Exam 12: The Analysis of Categorical Data and Goodness-Of-Fit Tests21 Questions
Exam 13: Simple Linear Regression and Correlation: Inferential Methods56 Questions
Exam 14: Multiple Regression Analysis38 Questions
Exam 15: Analysis of Variance40 Questions
Exam 16: Nonparametric Distribution-Free Statistical Methods15 Questions
Select questions type
The principal at John F. Kennedy High School has been asked to provide the average number of classes taken by the students at KHS. Since the computer system is down, she takes her alphabetized list of students, randomly selects 50 students, determines the number of classes each of the 50 selected students is taking, and calculates  . She then reports to the PTA "Since I took a large random sample, the population mean number of classes taken by the students at KHS is 5.4." Write a short paragraph to send to her that explains why her statement is not correct.
(Essay)
4.9/5  (45)
(45)
According to internal testing done by the Get-A-Grip tire company, the mean lifetime of tires sold on new cars is 23,000 miles, with a standard deviation of 2,500 miles.
a) If the claim by Get-A-Grip is true, what is the mean of the sampling distribution of  for samples of size n = 4?
b) If the claim by Get-A-Grip is true, what is the standard deviation of the sampling distribution of
for samples of size n = 4?
b) If the claim by Get-A-Grip is true, what is the standard deviation of the sampling distribution of  for samples of size n = 4?
c) If the distribution of tire life is approximately normal, what is the probability that the mean of a random sample of size n = 4 of tire lifetimes will be less than 20,000 miles?
for samples of size n = 4?
c) If the distribution of tire life is approximately normal, what is the probability that the mean of a random sample of size n = 4 of tire lifetimes will be less than 20,000 miles?
(Essay)
4.8/5 (33)
The distribution of  will always have the same shape as the distribution of the population being sampled.
(True/False)
4.8/5 (35)
For n sufficiently large, the distribution of  is approximately a standard normal distribution.
(True/False)
4.8/5 (26)
Consider the following "population": {2, 2, 4, 5}. Suppose that a random sample of size n = 2 is to be selected without replacement from this population. There are 6 possible samples (since the order of selection does not matter). Compute the sample mean for each of these samples and use that information to construct the sampling distribution of  . (Display it in table form.)
(Essay)
4.9/5 (28)
You will be asked to sketch curves representing the distributions of a set of data, as well as the sampling distributions of the mean under different conditions. You need not get these graphs perfectly correct, but should clearly indicate different aspects of the curves, such as location, variability, and shape. A very large study of college freshmen study habits found that the time (in hours) that freshmen study each week is approximately normal with mean 24 hours and standard deviation 8 hours. Consider random samples of size 16 from the population of freshmen.
a) On the axes below, sketch curves representing the distribution of the original population and the sampling distribution of  for a sample of size n = 16.
  b) What is the probability that a sample of size n = 16 from this population would result in a sample mean greater than 30 hours?
c) The study of college freshmen also asked about the students' time spent playing video games, and a relative frequency histogram of the results appears below. The mean amount of time spent playing video games was 0.8 hours per week.
b) What is the probability that a sample of size n = 16 from this population would result in a sample mean greater than 30 hours?
c) The study of college freshmen also asked about the students' time spent playing video games, and a relative frequency histogram of the results appears below. The mean amount of time spent playing video games was 0.8 hours per week. 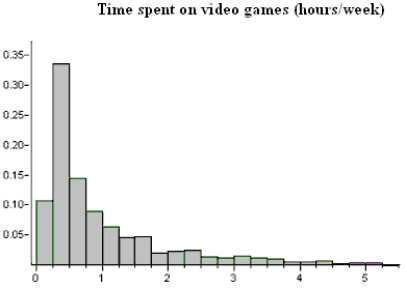 Suppose we were to take a random sample, n = 4, from this population of freshmen and ask them how much time they spent playing video games per week. Describe the shape, center, and spread of the sampling distribution of
  .
.
(Essay)
4.7/5 (37)
The standard deviation of the distribution of  decreases as n increases.
(True/False)
4.8/5 (28)
Filters
- Essay(0)
- Multiple Choice(0)
- Short Answer(0)
- True False(0)
- Matching(0)