Exam 7: Random Variables and Probability Distributions
Exam 1: The Role of Statistics and the Data Analysis Process17 Questions
Exam 2: Collecting Data Sensibly39 Questions
Exam 3: Graphical Methods for Describing Data25 Questions
Exam 4: Numerical Methods for Describing Data26 Questions
Exam 5: Summarizing Bivariate Data37 Questions
Exam 6: Probability34 Questions
Exam 7: Random Variables and Probability Distributions45 Questions
Exam 8: Sampling Variability and Sampling Distributions27 Questions
Exam 9: Estimation Using a Single Sample46 Questions
Exam 10: Hypothesis Testing Using a Single Sample37 Questions
Exam 11: Comparing Two Populations or Treatments42 Questions
Exam 12: The Analysis of Categorical Data and Goodness-Of-Fit Tests21 Questions
Exam 13: Simple Linear Regression and Correlation: Inferential Methods56 Questions
Exam 14: Multiple Regression Analysis38 Questions
Exam 15: Analysis of Variance40 Questions
Exam 16: Nonparametric Distribution-Free Statistical Methods15 Questions
Select questions type
In a major study by the statistics classes at Washington High School, city parking spaces were examined for compliance with the requirement to put money in the parking meters. Overall, the students found that 76% of metered parking places had meters that had not expired, and 24% had meters that were expired. If the traffic officer in charge of ticketing cars with expired meters checks meters at random, what is the probability he or she will find an expired meter before the 3rd one?
(Essay)
4.8/5  (35)
(35)
The distribution of all values of a random variable is called a normal distribution.
(True/False)
5.0/5 (37)
Briefly describe how one would decide which of two transformations was better for transforming skewed data to obtain a distribution that was approximately normal.
(Essay)
4.8/5 (30)
The famous physicist, Ernest Rutherford, was a pioneer in the study of radioactivity using electricity. In one experiment he observed the number of particles reaching a counter during time 1,700 intervals of 7.5 seconds each. The number of intervals that had 0 - 4 particles reaching the counter is given in the table below. 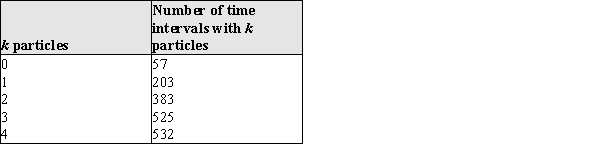 Let the random variable x = number of particles counted in a 7.5 second time period.
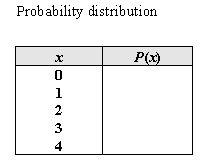
a) Fill in the table below with the estimated probability distribution of x, and sketch a probability histogram for x.
Let the random variable x = number of particles counted in a 7.5 second time period.
a) Fill in the table below with the estimated probability distribution of x, and sketch a probability histogram for x.
 Probability histogram
b) Using the estimated probabilities in part (a), estimate the following: i) P(x = 1), the probability that 1 particle was counted in 7.5 seconds. ii) P(x < 3), the probability that fewer than 3 particles were counted. iii) P(x ≥ 3), the probability that at least 3 particles were counted.
b) Using the estimated probabilities in part (a), estimate the following: i) P(x = 1), the probability that 1 particle was counted in 7.5 seconds. ii) P(x < 3), the probability that fewer than 3 particles were counted. iii) P(x ≥ 3), the probability that at least 3 particles were counted.
(Essay)
4.8/5 (37)
In a major study by the statistics classes at Jefferson High School, parking spaces were examined for compliance with the requirement to put money in the meters. Overall, the students found that 80% of metered parking places had meters that had not expired, and 20% had expired. If the traffic officer in charge of ticketing cars with expired meters, and starts at a random location in the City, what is the probability he or she will find an expired meter before the 3rd one?
(Essay)
4.9/5 (35)
When driving the nation's highways Anna is known as something of a lead foot. The number of miles per hour over the speed limit varies, but has a mean of 7.5 mph and standard deviation of 2 mph. Unfortunately, the state in which she goes to college adjusts the fines so that the amount of the fine is given by the formula: F = 10(MPH) + 112, where F is the amount of the fine, and MPH is the number of miles over the speed limit. Let random variable F be the amount of her fine if she is randomly stopped for speeding.
a) What is the mean of F?
b) What is the standard deviation of F?
(Essay)
4.8/5 (31)
For a continuous random variable x, the height of the density curve over an interval a to b represents the probability that x is between a and
b.
(True/False)
4.8/5 (32)
Fifty-five percent of the students at Thomas Jefferson High School use "lunch cards" to charge their lunch, rather than bringing money to school. Assuming that the method of payment (cash or lunch card) for one student is independent of the method of payment for the next student in line, what is the probability of observing the following sequence for the first five students through the lunch line? Cash, Card, Cash, Card, Cash
(Essay)
4.9/5 (29)
A normal probability plot suggests that a normal probability model is plausible if there is no obvious pattern in the scatter of points.
(True/False)
4.8/5 (39)
Suppose that the maximum daily temperature in Hacienda Heights, CA, for the month of December has a mean of 17° Celsius with a standard deviation of 3° Celsius. Let F be the random variable maximum daily temperature in degrees Fahrenheit. (Degrees  .)
a) What is the mean of F?
b) What is the standard deviation of F?
.)
a) What is the mean of F?
b) What is the standard deviation of F?
(Essay)
4.8/5 (35)
In the somewhat less than towering ski slopes of northeastern Iowa new skiers come to learn to ski. On Big Bunny Slope skiers will fail to make the turn at Big Bend. On Little Bunny Slope, skiers will sometimes tumble at Little Hill. The ski instructors send the new skiers down the two slopes in groups of 25, wait a few moments, and then send the Ski Patrol Ambulance down after them, stopping at Big Bend and then Little Hill. The skiers descend the slopes far enough apart that they don't run into each other, so their spills are all independent.
a) The probability that a random new skier in the group will need to be carried to the First Aid Station after a spill at Big Bend is 0.3. If we define the random variable B = number of new skiers needing to be driven to the First Aid Station from Big Bend, we can model this situation as a binomial chance experiment. What is the mean and standard deviation of B?
b) The probability that a random new skier in the group will need to be carried to the First Aid Station after a spill at Little Hill is 0.1. If we define the random variable L = number of new skiers needing to be driven to the First Aid Station from Little Hill, what is the mean and standard deviation of L?
c) The total number of injuries requiring the Ambulance, T, is a random variable formed by calculating B + L. What are the mean and standard deviation of the random variable T?
d) When the 25 skiers are sent down from the top of Big Bunny Slope, they are sent one at a time. What is the probability that the first one needing the Ambulance is the 7th one to be sent down the slope?
(Essay)
4.9/5 (33)
The owners of the Burger Emporium are looking for new supplier of onions for their famous hamburgers. It is important that the onion slice be roughly the same diameter as the hamburger patty. After careful analysis, they determine that they can only use onions with diameters between 9 and 10 cm. Company A provides onions with diameters that are approximately normally distributed with mean 10.3 cm and standard deviation of 1.2 cm. Company B provides onions with diameters that are approximately normally distributed with mean 10.6 cm and standard deviation of 0.9 cm. Which company provides the higher proportion of usable onions? Justify your choice with an appropriate statistical argument.
(Essay)
4.9/5 (29)
What information about a probability distribution do the mean and standard deviation of a random variable provide?
(Essay)
4.9/5 (34)
If x is a random variable, and random variable y is defined as follows, y = a + bx, then μy = |b| σx.
(True/False)
4.7/5 (33)
A random variable is continuous if the set of possible values includes an entire interval on the number line.
(True/False)
4.7/5 (39)
The standard normal distribution has a mean of 1 and standard deviation of 0.
(True/False)
4.7/5 (39)
At the University of Tough Love, good grades in math are very hard to come by. The grade distribution is shown in the table below:  Suppose three students are to be selected at random. As each is selected their math grades are written down and they are replaced back into the population of students. Three possible outcomes of this experiment are listed below. Calculate the probabilities of these sequences appearing.
a) ABC
b) CCF
c) BBA
Suppose three students are to be selected at random. As each is selected their math grades are written down and they are replaced back into the population of students. Three possible outcomes of this experiment are listed below. Calculate the probabilities of these sequences appearing.
a) ABC
b) CCF
c) BBA
(Essay)
4.8/5 (28)
At the College of Warm & Fuzzy, good grades in math are very easy to come by. The grade distribution is given in the table below:  Suppose three students are to be selected at random. As each is selected their math grades are written down and they are replaced back into the population of students. Three possible outcomes of this experiment are listed below. Calculate the probabilities of these sequences appearing.
a) BAC
b) CFF
c) ABA
Suppose three students are to be selected at random. As each is selected their math grades are written down and they are replaced back into the population of students. Three possible outcomes of this experiment are listed below. Calculate the probabilities of these sequences appearing.
a) BAC
b) CFF
c) ABA
(Essay)
4.9/5 (43)
Filters
- Essay(0)
- Multiple Choice(0)
- Short Answer(0)
- True False(0)
- Matching(0)