Exam 4: Numerical Methods for Describing Data
Exam 1: The Role of Statistics and the Data Analysis Process17 Questions
Exam 2: Collecting Data Sensibly39 Questions
Exam 3: Graphical Methods for Describing Data25 Questions
Exam 4: Numerical Methods for Describing Data26 Questions
Exam 5: Summarizing Bivariate Data37 Questions
Exam 6: Probability34 Questions
Exam 7: Random Variables and Probability Distributions45 Questions
Exam 8: Sampling Variability and Sampling Distributions27 Questions
Exam 9: Estimation Using a Single Sample46 Questions
Exam 10: Hypothesis Testing Using a Single Sample37 Questions
Exam 11: Comparing Two Populations or Treatments42 Questions
Exam 12: The Analysis of Categorical Data and Goodness-Of-Fit Tests21 Questions
Exam 13: Simple Linear Regression and Correlation: Inferential Methods56 Questions
Exam 14: Multiple Regression Analysis38 Questions
Exam 15: Analysis of Variance40 Questions
Exam 16: Nonparametric Distribution-Free Statistical Methods15 Questions
Select questions type
A wide variety of oak trees grow in the United States. In one study a sample of acorns was collected from different locations, and their volumes, in cm3, were recorded. In the table below are summary statistics for these data. 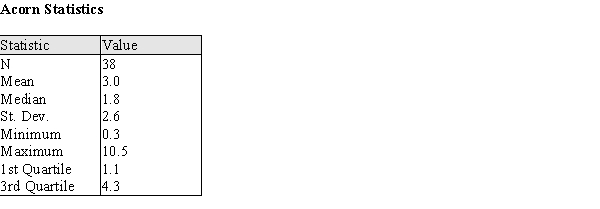 (a) Describe a procedure that uses these some or all of these summary statistics to determine whether outliers are present in the data.
(b) Using your procedure from part (a), determine if there are outliers in these data.
(a) Describe a procedure that uses these some or all of these summary statistics to determine whether outliers are present in the data.
(b) Using your procedure from part (a), determine if there are outliers in these data.
(Essay)
4.9/5  (38)
(38)
In order to attribute changes in nest activity to the active influence of the queen, 9 nests were randomly selected for experimental treatment. The normal activity of the nests were measured, and treatments were administered as described below: 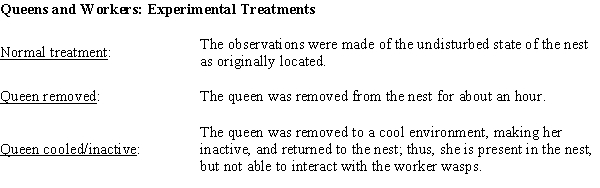 The data for the control treatment and each of the experimental treatments is given in the table below. The Activity Levels are the average proportion of active nest time for workers who were present in the normal and two experimental treatment periods. For example, 0.50 would mean for that nest the average amount of time the workers were actively working was 0.50 of the available time during that treatment. (The colony numbers are for identification in the table only.)
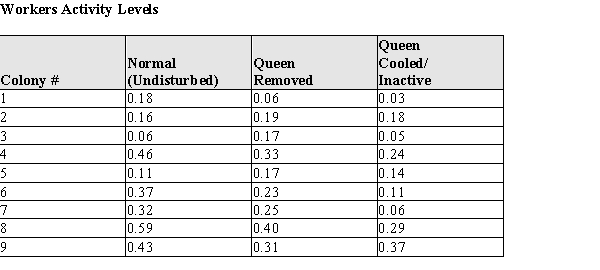
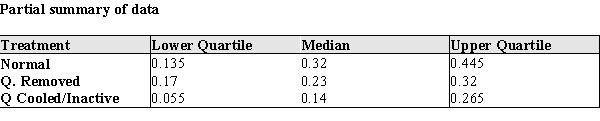
(a) Construct comparative box plots of the active nest times for (a) normal, (b) Queen removed, and (c) Queen Cooled/Inactive. (Note: since the data are proportions, there are no actual units for the data.)
(b) Two current theories about the queen's interaction with workers are that (A) the queen increases worker activity by her mere presence, or (B) she increases worker activity by interacting with worker bees. Based on your plot in part (a), which theory--if either--is supported by the data? Justify your conclusion with an appropriate statistical argument.
(c) What are the mean and standard deviation of the proportion of worker activity for undisturbed wasp nests.
(a) Construct comparative box plots of the active nest times for (a) normal, (b) Queen removed, and (c) Queen Cooled/Inactive. (Note: since the data are proportions, there are no actual units for the data.)
(b) Two current theories about the queen's interaction with workers are that (A) the queen increases worker activity by her mere presence, or (B) she increases worker activity by interacting with worker bees. Based on your plot in part (a), which theory--if either--is supported by the data? Justify your conclusion with an appropriate statistical argument.
(c) What are the mean and standard deviation of the proportion of worker activity for undisturbed wasp nests.  = s =
(d) One of the nests (Colony #4) has a proportion of worker activity of 0.46. How many standard deviations above/below the mean is the worker activity level in this nest?
(e) The biologists would like to provide some explanatory information for other scientists who would be using their new scale. They would like to state something like the following:
I. "Approximately _____ % of the undisturbed activity levels will be between −2σ and 2σ." OR
II. "At least _____ % of the undisturbed activity levels will be between −2σ and 2σ."
Based on your work so far, would you recommend using the Empirical Rule or Chebyshev's Rule to establish this percentage? Explain your reasoning in a few sentences.
(f) Using your recommended procedure from part (e) what percentage should be used to fill in the blank in the appropriate statement?
= s =
(d) One of the nests (Colony #4) has a proportion of worker activity of 0.46. How many standard deviations above/below the mean is the worker activity level in this nest?
(e) The biologists would like to provide some explanatory information for other scientists who would be using their new scale. They would like to state something like the following:
I. "Approximately _____ % of the undisturbed activity levels will be between −2σ and 2σ." OR
II. "At least _____ % of the undisturbed activity levels will be between −2σ and 2σ."
Based on your work so far, would you recommend using the Empirical Rule or Chebyshev's Rule to establish this percentage? Explain your reasoning in a few sentences.
(f) Using your recommended procedure from part (e) what percentage should be used to fill in the blank in the appropriate statement?
(Essay)
4.7/5 (30)
For any given data set, the median must be greater than or equal to the lower quartile, and less than or equal to the upper quartile.
(True/False)
4.7/5 (42)
When using a 20% trimmed mean, the largest 10% and the smallest 10% of the observations are discarded for calculation purposes.
(True/False)
4.9/5 (35)
The variance is the positive square root of the standard deviation.
(True/False)
4.8/5 (32)
Filters
- Essay(0)
- Multiple Choice(0)
- Short Answer(0)
- True False(0)
- Matching(0)