Exam 18: Simple Linear Regression and Correlation
Exam 1: What Is Statistics16 Questions
Exam 2: Types of Data, Data Collection and Sampling17 Questions
Exam 3: Graphical Descriptive Methods Nominal Data20 Questions
Exam 4: Graphical Descriptive Techniques Numerical Data64 Questions
Exam 5: Numerical Descriptive Measures150 Questions
Exam 6: Probability112 Questions
Exam 7: Random Variables and Discrete Probability Distributions55 Questions
Exam 8: Continuous Probability Distributions118 Questions
Exam 9: Statistical Inference: Introduction8 Questions
Exam 10: Sampling Distributions68 Questions
Exam 11: Estimation: Describing a Single Population132 Questions
Exam 12: Estimation: Comparing Two Populations23 Questions
Exam 13: Hypothesis Testing: Describing a Single Population130 Questions
Exam 14: Hypothesis Testing: Comparing Two Populations81 Questions
Exam 15: Inference About Population Variances47 Questions
Exam 16: Analysis of Variance125 Questions
Exam 17: Additional Tests for Nominal Data: Chi-Squared Tests116 Questions
Exam 18: Simple Linear Regression and Correlation219 Questions
Exam 19: Multiple Regression121 Questions
Exam 20: Model Building100 Questions
Exam 21: Nonparametric Techniques136 Questions
Exam 22: Statistical Inference: Conclusion106 Questions
Exam 23: Time-Series Analysis and Forecasting146 Questions
Exam 24: Index Numbers27 Questions
Exam 25: Decision Analysis51 Questions
Select questions type
A financier whose specialty is investing in movie productions has observed that, in general, movies with 'big-name' stars seem to generate more revenue than those movies whose stars are less well known. To examine his belief, he records the gross revenue and the payment (in $ million) given to the two highest-paid performers in the movie for 10 recently released movies. Movie Cost of two highest- paid performers (\ ) Gross revenue (\ ) 1 5.3 48 2 7.2 65 3 1.3 18 4 1.8 20 5 3.5 31 6 2.6 26 7 8.0 73 8 2.4 23 9 4.5 39 10 6.7 58 a. Determine the least squares regression line.
b. Interpret the value of the slope of the regression line.
c. Determine the standard error of estimate, and describe what this statistic tells you about the regression line.
(Essay)
4.9/5  (26)
(26)
When the variance, , of the error variable is a constant no matter what the value of x is, this condition is called: A. homocausality. B. heteroscedasticity. C. homoscedasticity. D. heterocausality.
(Short Answer)
4.8/5 (42)
Which of the following statements is correct when all the actual values of y are on an upward sloping regression line? A The coefficient of correlation is equal to one and the sign of the coefficient of correlation will be negative but the sign of the slope with be positive. B The coefficient of correlation and the slope must both be equal to 1 . C The coefficient of correlation is equal to one and the sign of the coefficient of correlation and the sign of the slope will both be positive. D The coefficient of correlation and the slope must be equal to -1 .
(Short Answer)
4.8/5 (43)
The editor of a major academic book publisher claims that a large part of the cost of books is the cost of paper. This implies that larger books will cost more money. As an experiment to analyse the claim, a university student visits the bookstore and records the number of pages and the selling price of 12 randomly selected books. These data are listed below. Book Number of pages Selling price (\ ) 1 844 55 2 727 50 3 360 35 4 915 60 5 295 30 6 706 50 7 410 40 8 905 53 9 1058 65 10 865 54 11 677 42 12 912 58 Determine the coefficient of determination, and discuss what its value tells you.
(Essay)
4.7/5 (31)
In a regression problem, if all the values of the independent variable are equal, then the coefficient of determination must be: A. 1.0. B. 0.5. C. 0.0. D. -1.0.
(Short Answer)
4.8/5 (31)
If the standard error of estimate = 15 and n = 12, then the sum of squares for error, SSE, is: A. 150. B. 180. C. 225. D. 2250.
(Short Answer)
4.9/5 (42)
If all the points in a scatter diagram lie on the least squares regression line, then the coefficient of correlation must be: A 1.0 B -1.0 C either 1.0 or -1.0 D 0.0
(Short Answer)
4.9/5 (35)
The editor of a major academic book publisher claims that a large part of the cost of books is the cost of paper. This implies that larger books will cost more money. As an experiment to analyse the claim, a university student visits the bookstore and records the number of pages and the selling price of 12 randomly selected books. These data are listed below. Book Number of pages Selling price (\ ) 1 844 55 2 727 50 3 360 35 4 915 60 5 295 30 6 706 50 7 410 40 8 905 53 9 1058 65 10 865 54 11 677 42 12 912 58 Draw a scatter diagram of the data and plot the least squares regression line on it.
(Essay)
4.7/5 (39)
The value of the sum of squares for regression, SSR, can never be equal to the value of total sum of squares, SST.
(True/False)
4.9/5 (38)
The manager of a fast food restaurant wants to determine how sales in a given week are related to the number of discount vouchers (#) printed in the local newspaper during the week. The number of vouchers and sales ($000s) from 10 randomly selected weeks is given below with the predicted sales.
Calculate the residuals. Observation Sales Predicted Sales 1 12.8 13.4147 2 15.4 14.8000 3 13.9 13.8765 4 11.2 12.9529 5 18.7 20.3412 6 17.9 16.1853 7 16.8 15.2618 8 15.9 14.3382 9 11.5 12.9529 10 13.9 13.8765
(Essay)
4.7/5 (34)
The standardised residual is defined as: A residual divided by the standard error of estimate. B residual multiplied by the square root of the standard error of estimate. C residual divided by the square of the standard error of estimate. D residual multiplied by the standard error of estimate.
(Short Answer)
4.9/5 (30)
Plot the residuals against the predicted values of y. Does the variance appear to be constant?
(Essay)
4.8/5 (30)
Consider the following data values of variables x and y. x 3 5 7 9 11 14 y 7 10 17 20 27 35 Calculate the coefficient of determination, and describe what this statistic tells you about the relationship between the two variables.
(Essay)
4.8/5 (31)
One method of diagnosing autocorrelation is to plot the residuals against the time periods to see whether some pattern emerges.
(True/False)
4.9/5 (30)
The dean of a faculty of business in Victoria believes that students who do well in 'soft' courses like organisational behaviour do poorly in 'hard' courses like business statistics. In order to test his belief, he takes a random sample of 10 students and records their test grades in organisational behaviour and statistics. The results are shown below. Do these data provide sufficient evidence at the 5% significance level to support the dean's claim? Student Organisational B ehaviour Grade Business Statistics Grade 1 C A 2 D A 3 A C 4 B C 5 A D 6 C B 7 B C 8 A C 9 C A 10 B C
(Essay)
4.8/5 (28)
Pop-up coffee vendors have been popular in the city of Adelaide in 2013. A vendor is interested in knowing how temperature (in degrees Celsius) impacts daily hot coffee sales revenue (in $00's).
A random sample of 6 days was taken, with the daily hot coffee sales revenue and the corresponding temperature of that day noted. Excel output given below. Coffee sales revenue Temperature 6.50 25 10.00 17 5.50 30 4.50 35 3.50 40 28.00 9 SUMMARY OUTPUT Regression Stotistics Multiple R 0.8644 RSquare 0.7472 Adjusted R Square 0.6840 Stan dard Error 5.2027 Observations 6 ANOVA Significance df S MS F F Regression 1 320.0617 320.0617 11.8244 0.0263 Residual 4 108.2716 27.0679 Total 5 428.3333 Coefficients Standord Error t Stat p-value Lower 95\% Upper 95\% Intercept 27.7179 5.6629 4.8946 0.0081 11.9952 43.4406 Temperature -0.6943 0.2019 -3.4387 0.0263 -1.2549 -0.1337 Test the hypothesis that the population intercept is positive, at the 5% level of significance.
(Essay)
4.9/5 (42)
The manager of a fast food restaurant wants to determine how sales in a given week are related to the number of discount vouchers (#) printed in the local newspaper during the week. The number of vouchers and sales ($000s) from 10 randomly selected weeks is given below with the predicted sales. 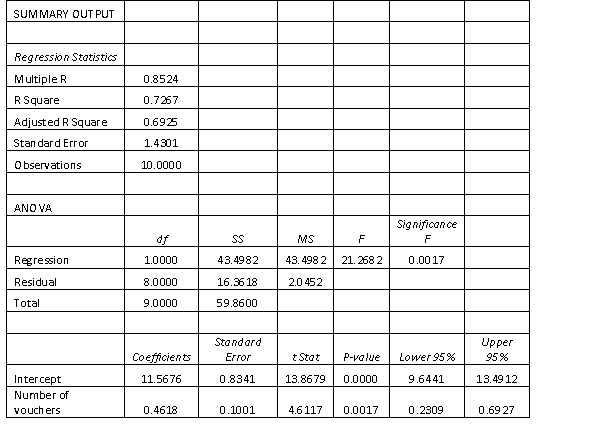 Compute the standardised residuals.
(Essay)
4.9/5 (40)
An ardent fan of television game shows has observed that, in general, the more educated the contestant, the less money he or she wins. To test her belief, she gathers data about the last eight winners of her favourite game show. She records their winnings in dollars and their years of education and performs a simple linear regression, with the Excel output provided . Contestant Years of education Winnings 1 11 750 2 15 400 3 12 600 4 16 350 5 11 800 6 16 300 7 13 650 8 14 400 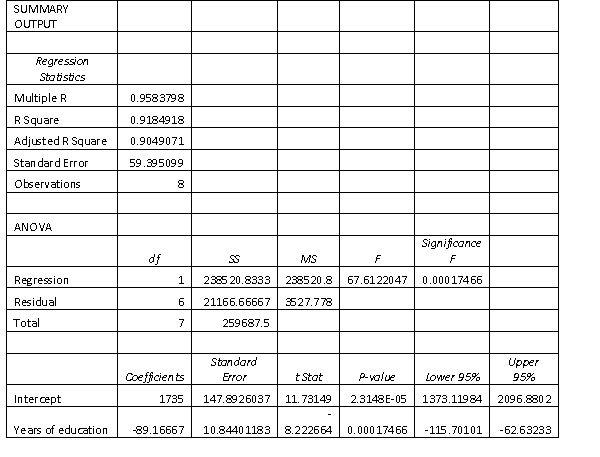 a. Determine the least squares regression line.
b. Interpret the value of the slope of the regression line.
c. Determine the standard error of estimate, and describe what this statistic tells you about the regression line.
d. Interpret the coefficient of correlation
a. Determine the least squares regression line.
b. Interpret the value of the slope of the regression line.
c. Determine the standard error of estimate, and describe what this statistic tells you about the regression line.
d. Interpret the coefficient of correlation
(Essay)
4.7/5 (32)
A simple linear regression equation is given by  . The point estimate of when = 4 is 20.45.
(True/False)
4.8/5 (40)
Filters
- Essay(0)
- Multiple Choice(0)
- Short Answer(0)
- True False(0)
- Matching(0)