Exam 15: Time Series Analysis and Forecasting
Exam 1: Introduction63 Questions
Exam 2: An Introduction to Linear Programming66 Questions
Exam 3: Linear Programming: Sensitivity Analysis and Interpretation of Solution56 Questions
Exam 4: Linear Programming Applications in Marketing, Finance, and Operations Management63 Questions
Exam 5: Advanced Linear Programming Applications46 Questions
Exam 6: Distribution and Network Models70 Questions
Exam 7: Integer Linear Programming61 Questions
Exam 8: Nonlinear Optimization Models51 Questions
Exam 9: Project Scheduling: Pertcpm59 Questions
Exam 10: Inventory Models65 Questions
Exam 11: Waiting Line Models68 Questions
Exam 12: Simulation62 Questions
Exam 13: Decision Analysis97 Questions
Exam 14: Multicriteria Decisions50 Questions
Exam 15: Time Series Analysis and Forecasting63 Questions
Exam 16: Markov Processes49 Questions
Exam 17: Linear Programming: Simplex Method51 Questions
Exam 18: Simplex-Based Sensitivity Analysis and Duality35 Questions
Exam 19: Solution Procedures for Transportation and Assignment Problems44 Questions
Exam 20: Minimal Spanning Tree19 Questions
Exam 21: Dynamic Programming38 Questions
Select questions type
Using a naive forecasting method, the forecast for next week's sales volume equals
(Multiple Choice)
5.0/5  (28)
(28)
If the random variability in a time series is great, a high α value should be used to exponentially smooth out the fluctuations.
(True/False)
4.9/5 (39)
Describe a time series plot and discuss its purpose and when in the forecasting process it should be constructed.
(Essay)
4.9/5 (41)
A time series model with a seasonal pattern will always involve quarterly data.
(True/False)
4.8/5 (35)
All of the following are true about time series methods except
(Multiple Choice)
4.8/5 (40)
How can error measures be used to determine the number of periods to use in a moving average? What are you
assuming about the future when you make this choice?
(Essay)
4.8/5 (32)
The number of girls who attend a summer basketball camp has been recorded for the seven years the camp has been offered. Use exponential smoothing with a smoothing constant of .8 to forecast attendance for the eighth year.
47, 68, 65, 92, 98, 121, 146
(Essay)
4.9/5 (38)
The exponential smoothing forecast for any period is a weighted average of all the previous actual values for the time series.
(True/False)
4.8/5 (34)
Time series methods base forecasts only on past values of the variables.
(True/False)
4.8/5 (26)
The number of pizzas ordered on Friday evenings between 5:30 and 6:30 at a pizza delivery location for the last 10 weeks is shown below. Use exponential smoothing with smoothing constants of .2 and .8 to forecast a value for week 11. Compare your forecasts using MSE. Which smoothing constant would you prefer?
58, 46, 55, 39, 42, 63, 54, 55, 61, 52
(Essay)
4.9/5 (38)
Which of the following forecasting methods puts the least weight on the most recent time series value?
(Multiple Choice)
4.8/5 (31)
The number of plumbing repair jobs performed by Auger's Plumbing Service in each of the last nine months are listed below. 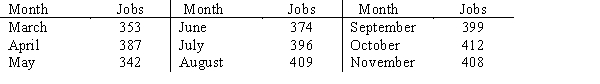
a.Assuming a linear trend function, forecast the number of repair jobs Auger's will perform in December using the least squares method.
b.What is your forecast for December using a three-period weighted moving average with weights of .6, .3, and .1? How does it compare with your forecast from part (a)?
(Essay)
4.8/5 (39)
Explain what conditions make quantitative forecasting methods appropriate.
(Essay)
4.9/5 (36)
Business at Terry's Tie Shop can be viewed as falling into three distinct seasons: (1) Christmas (November-December); (2) Father's Day (late May - mid-June); and (3) all other times. Average weekly sales (in $'s) during each of these three seasons during the past four years has been as follows: 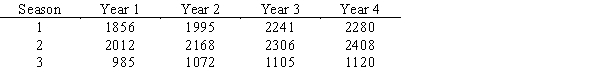
Determine a forecast for the average weekly sales in years 5 and 6 for each of the three seasons.
Determine a forecast for the average weekly sales in years 5 and 6 for each of the three seasons.
(Essay)
4.8/5 (22)
Linear trend is calculated as 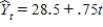 . The trend projection for period 15 is
(Multiple Choice)
4.9/5 (41)
Filters
- Essay(0)
- Multiple Choice(0)
- Short Answer(0)
- True False(0)
- Matching(0)