Exam 2: Organizing and Visualizing Variables
Exam 1: Defining and Collecting Data205 Questions
Exam 2: Organizing and Visualizing Variables212 Questions
Exam 3: Numerical Descriptive Measures163 Questions
Exam 4: Basic Probability171 Questions
Exam 5: Discrete Probability Distributions117 Questions
Exam 6: The Normal Distribution144 Questions
Exam 7: Sampling Distributions127 Questions
Exam 8: Confidence Interval Estimation187 Questions
Exam 9: Fundamentals of Hypothesis Testing: One-Sample Tests177 Questions
Exam 10: Two-Sample Tests300 Questions
Exam 11: Chi-Square Tests128 Questions
Exam 12: Simple Linear Regression204 Questions
Exam 13: Multiple Regression307 Questions
Exam 14: Business Analytics254 Questions
Select questions type
In constructing a polygon, each class grouping is represented by its and then these are consecutively connected to one another.
(Essay)
4.8/5  (24)
(24)
SCENARIO 2-4
A survey was conducted to determine how people rated the quality of programming available on television.Respondents were asked to rate the overall quality from 0 (no quality at all) to 100 (extremely good quality).The stem-and-leaf display of the data is shown below. Stem Leaves 3 24 4 03478999 5 0112345 6 12566 7 01 8 9 2
-Referring to Scenario 2-4, what percentage of the respondents rated overall television quality with a rating from 50 through 75?
(Multiple Choice)
4.7/5 (28)
SCENARIO 2-17
The following table presents total retail sales in millions of dollars for the leading apparel companies over a two-year period in the past. APPAREL COMPANY Year 1 Year 2 Gap 1,159.0 962.0 TJX 781.7 899.0 Limited 596.5 620.4 Kohl's 544.9 678.9 Nordstrom 402.6 418.3 Talbots 139.9 130.1 Ann Taylor 114.2 124.8
-Referring to Scenario 2-17, construct a table of column percentages.
(Essay)
4.9/5 (35)
SCENARIO 2-8
The Stem-and-Leaf display represents the number of times in a year that a random sample of 100 "lifetime" members of a health club actually visited the facility. Stem Leaves 0 01222223333334445666666667789999 1 1111222234444555669999 2 00011223455556889 3 0000446799 4 011345567 5 0077 6 8 7 67 8 3 9 0247
-Referring to Scenario 2-8, the person who visited the health club more than anyone else in the sample visited the facility times.
(Essay)
4.8/5 (36)
The Best Practices for Creating Visual Summaries recommend labeling all axes only when it is possible.
(True/False)
4.9/5 (30)
SCENARIO 2-18
The stem-and-leaf display below shows the result of a survey on 50 students on their satisfaction with their school with the higher scores represent higher level of satisfaction. 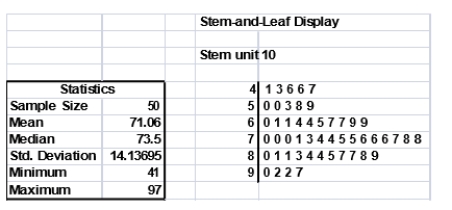 -Referring to Scenario 2-18, how many students have a satisfaction level of at least 80?
(Essay)
4.9/5 (39)
SCENARIO 2-14
The table below contains the number of people who own a portable Blu-ray player in a sample of 600 broken down by gender. Own a Portable Blu-ray player Male Female Yes 96 40 No 224 240
-Referring to Scenario 2-14, if the sample is a good representation of the population, we can expect percent of those who own a portable Blu-ray player in the population will be males.
(Essay)
4.7/5 (26)
You have collected data on the responses to two questions asked in a survey of 40 college students majoring in business-What is your gender (Male = M; Female = F) and What is your major (Accountancy = A; Computer Information Systems = C; Marketing = M).Which of the following is the best for presenting the data?
(Multiple Choice)
4.7/5 (34)
A good choice for the number of class groups to use in constructing frequency distribution is to have at least 5 but no more than 15 class groups.
(True/False)
5.0/5 (36)
SCENARIO 2-15
The figure below is the ogive for fat (in grams) for a sample of 36 pizza products where the upper boundaries of the intervals are: 5, 10, 15, 20, 25, and 30.
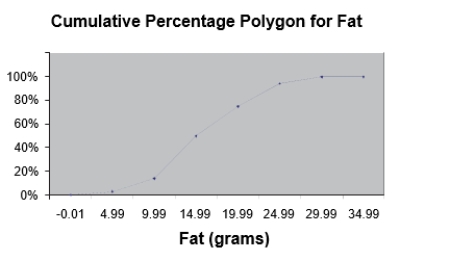 -Referring to Scenario 2-15, what percentage of pizza products contains at least 20 grams of fat?
(Multiple Choice)
4.9/5 (34)
SCENARIO 2-9
The frequency distribution below represents the rents of 250 randomly selected federally subsidized apartments in a small town. Rentin \ Frequency 1,100 but less than 1,200 113 1,200 but less than 1,300 85 1,300 but less than 1,400 32 1,400 but less than 1,500 16 1,500 but less than 1,600 4
-Referring to Scenario 2-9, apartments rented for at least $1,200 but less than $1,400.
(Essay)
4.7/5 (35)
SCENARIO 2-13
Given below is the stem-and-leaf display representing the amount of detergent used in gallons (with leaves in 10ths of gallons) in a day by 25 drive-through car wash operations in Phoenix. 9\mid147 10\mid02238 11\mid135566777 12\mid223489 13\mid02
-Referring to Scenario 2-13, construct a cumulative percentage distribution for the detergent data if the corresponding frequency distribution uses "9.0 but less than 10.0" as the first class.
(Essay)
4.9/5 (33)
SCENARIO 2-16
The figure below is the percentage polygon for the number of calories for a sample of 36 pizzas products where the upper limits of the intervals are: 310, 340, 370, 400 and 430. 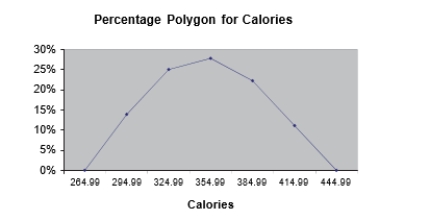 -Referring to Scenario 2-16, roughly what percentage of pizza products contains at least 340 calories?
(Multiple Choice)
4.8/5 (36)
SCENARIO 2-13
Given below is the stem-and-leaf display representing the amount of detergent used in gallons (with leaves in 10ths of gallons) in a day by 25 drive-through car wash operations in Phoenix. 9\mid147 10\mid02238 11\mid135566777 12\mid223489 13\mid02
-Referring to Scenario 2-13, construct a percentage polygon for the detergent data if the corresponding frequency distribution uses "9.0 but less than 10.0" as the first class.
(Essay)
4.8/5 (34)
SCENARIO 2-14
The table below contains the number of people who own a portable Blu-ray player in a sample of 600 broken down by gender. Own a Portable Blu-ray player Male Female Yes 96 40 No 224 240
-Referring to Scenario 2-14, percent of the 600 were females.
(Essay)
4.8/5 (29)
If you wish to construct a graph of a relative frequency distribution, you would most likely construct an ogive first.
(True/False)
4.7/5 (36)
SCENARIO 2-18
The stem-and-leaf display below shows the result of a survey on 50 students on their satisfaction with their school with the higher scores represent higher level of satisfaction.
-Referring to Scenario 2-18, what was the highest level of satisfaction?
(Essay)
4.8/5 (43)
SCENARIO 2-18
The stem-and-leaf display below shows the result of a survey on 50 students on their satisfaction with their school with the higher scores represent higher level of satisfaction.
-Referring to Scenario 2-18, if a student is randomly selected, his/her most likely level of satisfaction will be in the 70s among the 40s, 50s, 60s, 70s, 80s and 90s.
(True/False)
4.9/5 (33)
SCENARIO 2-12
The table below contains the opinions of a sample of 200 people broken down by gender about the latest congressional plan to eliminate anti-trust exemptions for professional baseball. For Neutral Against Totals Female 38 54 12 104 Male 12 36 48 96 Totals 50 90 60 200
-Referring to Scenario 2-12, percent of the 200 were not neutral.
(Essay)
4.9/5 (41)
Filters
- Essay(0)
- Multiple Choice(0)
- Short Answer(0)
- True False(0)
- Matching(0)