Exam 2: Organizing and Visualizing Variables
Exam 1: Defining and Collecting Data205 Questions
Exam 2: Organizing and Visualizing Variables212 Questions
Exam 3: Numerical Descriptive Measures163 Questions
Exam 4: Basic Probability171 Questions
Exam 5: Discrete Probability Distributions117 Questions
Exam 6: The Normal Distribution144 Questions
Exam 7: Sampling Distributions127 Questions
Exam 8: Confidence Interval Estimation187 Questions
Exam 9: Fundamentals of Hypothesis Testing: One-Sample Tests177 Questions
Exam 10: Two-Sample Tests300 Questions
Exam 11: Chi-Square Tests128 Questions
Exam 12: Simple Linear Regression204 Questions
Exam 13: Multiple Regression307 Questions
Exam 14: Business Analytics254 Questions
Select questions type
SCENARIO 2-14
The table below contains the number of people who own a portable Blu-ray player in a sample of 600 broken down by gender. Own a Portable Blu-ray player Male Female Yes 96 40 No 224 240
-Referring to Scenario 2-14, percent of the 600 owned a portable Blu-ray player.
(Essay)
4.8/5  (43)
(43)
SCENARIO 2-12
The table below contains the opinions of a sample of 200 people broken down by gender about the latest congressional plan to eliminate anti-trust exemptions for professional baseball. For Neutral Against Totals Female 38 54 12 104 Male 12 36 48 96 Totals 50 90 60 200
-Referring to Scenario 2-12, of the males in the sample, percent were for the plan.
(Essay)
4.8/5 (42)
SCENARIO 2-11
The ordered array below resulted from selecting a sample of 25 batches of 500 computer chips and determining how many in each batch were defective. Defects 1 2 4 4 5 5 6 7 9 9 12 12 15 17 20 21 23 23 25 26 27 27 28 29 29
-Referring to Scenario 2-11, if a frequency distribution for the defects data is constructed, using "0 but less than 5" as the first class, the frequency of the "20 but less than 25" class would be_.
(Essay)
4.9/5 (44)
Given below is the scatter plot of the price/earnings ratio versus earnings per share of 20 U.S.companies.There appears to be a negative relationship between price/earnings ratio and earnings per share. 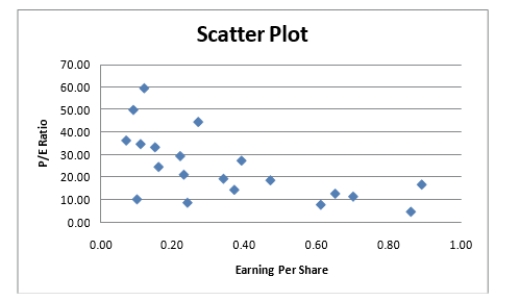
(True/False)
4.9/5 (43)
SCENARIO 2-10
The relative frequency histogram below represents scores achieved by 200 job applicants on a personality profile. 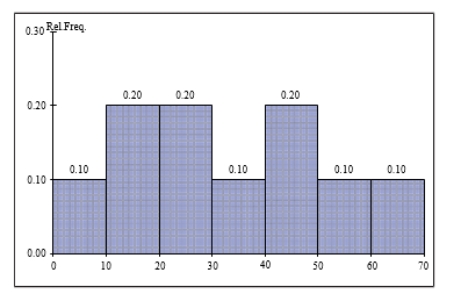 -Referring to the histogram from Scenario 2-10, the number of job applicants who scored 50 or above is .
(Essay)
4.9/5 (28)
SCENARIO 2-5
The following are the duration in minutes of a sample of long-distance phone calls made within the continental United States reported by one long-distance carrier. Time(inMinutes) Relative Frequency 0 but less than 5 0.37 5 but less than 10 0.22 10 but less than 15 0.15 15 but less than 20 0.10 20 but less than 25 0.07 25 but less than 30 0.07 30 or more 0.02
-Referring to Scenario 2-5, if 100 calls were sampled, of them would have lasted less than 15 minutes.
(Multiple Choice)
4.8/5 (26)
The sum of relative frequencies in a distribution always equals 1.
(True/False)
4.8/5 (31)
SCENARIO 2-12
The table below contains the opinions of a sample of 200 people broken down by gender about the latest congressional plan to eliminate anti-trust exemptions for professional baseball. For Neutral Against Totals Female 38 54 12 104 Male 12 36 48 96 Totals 50 90 60 200
-Referring to Scenario 2-12, of those for the plan in the sample, percent were females.
(Essay)
4.7/5 (31)
SCENARIO 2-5
The following are the duration in minutes of a sample of long-distance phone calls made within the continental United States reported by one long-distance carrier. Time(inMinutes) Relative Frequency 0 but less than 5 0.37 5 but less than 10 0.22 10 but less than 15 0.15 15 but less than 20 0.10 20 but less than 25 0.07 25 but less than 30 0.07 30 or more 0.02
-Referring to Scenario 2-5, what is the cumulative relative frequency for the percentage of calls that lasted under 20 minutes?
(Multiple Choice)
4.7/5 (35)
SCENARIO 2-10
The relative frequency histogram below represents scores achieved by 200 job applicants on a personality profile.
-Referring to the histogram from Scenario 2-10, the number of job applicants who scored between30 and below 60 is _.
(Essay)
4.8/5 (37)
Which of the following is appropriate for displaying data collected on the different brands of cars students at a major university drive?
(Multiple Choice)
5.0/5 (40)
SCENARIO 2-14
The table below contains the number of people who own a portable Blu-ray player in a sample of 600 broken down by gender. Own a Portable Blu-ray player Male Female Yes 96 40 No 224 240
-Referring to Scenario 2-14, of those who did not own a portable Blu-ray player in the sample,percent were males.
(Essay)
4.7/5 (28)
A multidimensional contingency table allows you to tally the responses of more than two continuous variables.
(True/False)
4.9/5 (35)
SCENARIO 2-4
A survey was conducted to determine how people rated the quality of programming available on television.Respondents were asked to rate the overall quality from 0 (no quality at all) to 100 (extremely good quality).The stem-and-leaf display of the data is shown below. Stem Leaves 3 24 4 03478999 5 0112345 6 12566 7 01 8 9 2
-Referring to Scenario 2-4, what percentage of the respondents rated overall television quality with a rating of 80 or above?
(Multiple Choice)
4.7/5 (32)
The original data values cannot be determined once they are grouped into a frequency distribution table.
(True/False)
4.8/5 (34)
SCENARIO 2-7
The Stem-and-Leaf display below contains data on the number of months between the date a civil suit is filed and when the case is actually adjudicated for 50 cases heard in superior court.Stem Leaves 1 234447899 2 22223455678889 3 0011135778 4 02345579 5 112466 6 158
-Referring to Scenario 2-7, if a frequency distribution with equal sized classes was made from this data, and the first class was "10 but less than 20," the relative frequency of the third class would be _.
(Essay)
4.8/5 (31)
A is a vertical bar chart in which the rectangular bars are constructed at the boundaries of each class interval.
(Essay)
4.9/5 (33)
When constructing charts, the following is plotted at the class midpoints:
(Multiple Choice)
4.8/5 (32)
Histograms are used for numerical data while bar charts are suitable for categorical data.
(True/False)
4.8/5 (31)
Filters
- Essay(0)
- Multiple Choice(0)
- Short Answer(0)
- True False(0)
- Matching(0)