Exam 2: Organizing and Visualizing Variables
Exam 1: Defining and Collecting Data205 Questions
Exam 2: Organizing and Visualizing Variables212 Questions
Exam 3: Numerical Descriptive Measures163 Questions
Exam 4: Basic Probability171 Questions
Exam 5: Discrete Probability Distributions117 Questions
Exam 6: The Normal Distribution144 Questions
Exam 7: Sampling Distributions127 Questions
Exam 8: Confidence Interval Estimation187 Questions
Exam 9: Fundamentals of Hypothesis Testing: One-Sample Tests177 Questions
Exam 10: Two-Sample Tests300 Questions
Exam 11: Chi-Square Tests128 Questions
Exam 12: Simple Linear Regression204 Questions
Exam 13: Multiple Regression307 Questions
Exam 14: Business Analytics254 Questions
Select questions type
The addition of visual elements that either fail to convey any useful information or that obscure important points about the data to enhance the visualization of data is called .
(Essay)
4.7/5  (35)
(35)
Data on the number of part-time hours students at a public university worked in a week were collected.Which of the following is the best chart for presenting the information?
(Multiple Choice)
4.9/5 (35)
SCENARIO 2-4
A survey was conducted to determine how people rated the quality of programming available on television.Respondents were asked to rate the overall quality from 0 (no quality at all) to 100 (extremely good quality).The stem-and-leaf display of the data is shown below. Stem Leaves 3 24 4 03478999 5 0112345 6 12566 7 01 8 9 2
-Referring to Scenario 2-4, what percentage of the respondents rated overall television quality with a rating of 50 or below?
(Multiple Choice)
4.8/5 (31)
SCENARIO 2-6
A sample of 200 students at a Big-Ten university was taken after the midterm to ask them whether they went bar hopping the weekend before the midterm or spent the weekend studying, and whether they did well or poorly on the midterm.The following table contains the result. Did Well in Midterm Did Poorly in Midterm Studying for Exam 80 20 Went Bar Hopping 30 70
-Referring to Scenario 2-6, of those who went bar hopping the weekend before the midterm in the sample, percent of them did well on the midterm.
(Multiple Choice)
4.7/5 (30)
In determining the class interval width, is the denominator in the formula.
(Essay)
4.8/5 (36)
SCENARIO 2-8
The Stem-and-Leaf display represents the number of times in a year that a random sample of 100 "lifetime" members of a health club actually visited the facility. Stem Leaves 0 01222223333334445666666667789999 1 1111222234444555669999 2 00011223455556889 3 0000446799 4 011345567 5 0077 6 8 7 67 8 3 9 0247
-Referring to Scenario 2-8, of the 100 members visited the health club no more than 12 times in a year.
(Essay)
4.8/5 (32)
SCENARIO 2-18
The stem-and-leaf display below shows the result of a survey on 50 students on their satisfaction with their school with the higher scores represent higher level of satisfaction. 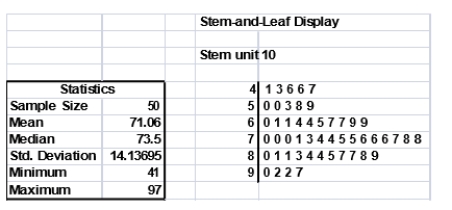 -Referring to Scenario 2-18, what was the lowest level of satisfaction?
(Essay)
4.8/5 (33)
To evaluate two categorical variables at the same time, a could be developed.
(Essay)
4.9/5 (22)
The Best Practices for Creating Visual Summaries recommend always starting the scale for a vertical axis at zero.
(True/False)
4.9/5 (22)
SCENARIO 2-3
Every spring semester, the School of Business coordinates a luncheon with local business leaders for graduating seniors, their families, and friends.Corporate sponsorship pays for the lunches of each of the seniors, but students must purchase tickets to cover the cost of lunches served to guests they bring with them.The following histogram represents the attendance at the senior luncheon, where X is the number of guests each graduating senior invited to the luncheon and f is the number of graduating seniors in each category. 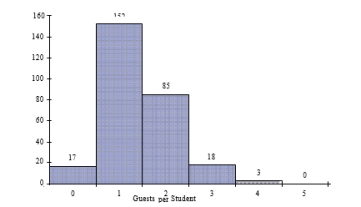 -Referring to the histogram from Scenario 2-3, how many graduating seniors attended the luncheon?
(Multiple Choice)
4.9/5 (33)
Given below is the scatter plot of the price/earnings ratio versus earnings per share of 20 U.S.companies.There appear to be a positive relationship between price/earnings ratio and earnings per share. 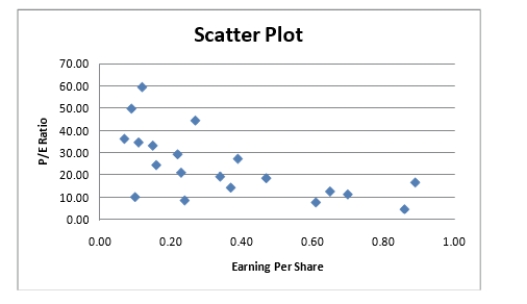
(True/False)
4.7/5 (40)
SCENARIO 2-10
The relative frequency histogram below represents scores achieved by 200 job applicants on a personality profile. 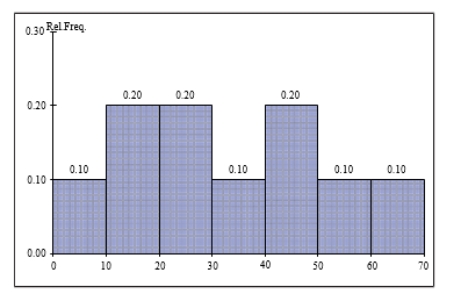 -Referring to the histogram from Scenario 2-10, percent of the applicants scored below20 or at least 50.
(Essay)
4.8/5 (35)
SCENARIO 2-17
The following table presents total retail sales in millions of dollars for the leading apparel companies over a two-year period in the past. APPAREL COMPANY Year 1 Year 2 Gap 1,159.0 962.0 TJX 781.7 899.0 Limited 596.5 620.4 Kohl's 544.9 678.9 Nordstrom 402.6 418.3 Talbots 139.9 130.1 Ann Taylor 114.2 124.8
-Referring to Scenario 2-17, among the 8 stores, saw a sales decline.
(Essay)
4.8/5 (36)
2-2 Organizing and Visualizing Variables
At a meeting of information systems officers for regional offices of a national company, a survey was taken to determine the number of employees the officers supervise in the operation of their departments, where X is the number of employees overseen by each information systems officer. X f 1 7 2 5 3 11 4 8 5 9
-Referring to Scenario 2-2, how many regional offices are represented in the survey results?
(Multiple Choice)
4.9/5 (35)
Apple Computer, Inc.collected information on the age of their customers.Suppose the youngest customer was 12 and the oldest was 72.To study the distribution of the age among its customers, it can use a Pareto chart.
(True/False)
4.9/5 (36)
True of False: To determine the width of class interval, divide the number of class groups by the range of the data.
(True/False)
4.8/5 (29)
SCENARIO 2-8
The Stem-and-Leaf display represents the number of times in a year that a random sample of 100 "lifetime" members of a health club actually visited the facility. Stem Leaves 0 01222223333334445666666667789999 1 1111222234444555669999 2 00011223455556889 3 0000446799 4 011345567 5 0077 6 8 7 67 8 3 9 0247
-Referring to Scenario 2-8, of the 100 members visited the health club at least 52 times in a year.
(Essay)
4.7/5 (26)
A multidimensional contingency table allows you to tally the responses of more than two categorical variables.
(True/False)
4.9/5 (34)
SCENARIO 2-10
The relative frequency histogram below represents scores achieved by 200 job applicants on a personality profile.
-Referring to the histogram from Scenario 2-10, 90% of the job applicants scored above or equal to .
(Essay)
4.9/5 (27)
The percentage polygon is formed by having the lower boundary of each class represent the data in that class and then connecting the sequence of lower boundaries at their respective class percentages.
(True/False)
4.9/5 (37)
Filters
- Essay(0)
- Multiple Choice(0)
- Short Answer(0)
- True False(0)
- Matching(0)