Exam 2: Organizing and Visualizing Variables
Exam 1: Defining and Collecting Data205 Questions
Exam 2: Organizing and Visualizing Variables212 Questions
Exam 3: Numerical Descriptive Measures163 Questions
Exam 4: Basic Probability171 Questions
Exam 5: Discrete Probability Distributions117 Questions
Exam 6: The Normal Distribution144 Questions
Exam 7: Sampling Distributions127 Questions
Exam 8: Confidence Interval Estimation187 Questions
Exam 9: Fundamentals of Hypothesis Testing: One-Sample Tests177 Questions
Exam 10: Two-Sample Tests300 Questions
Exam 11: Chi-Square Tests128 Questions
Exam 12: Simple Linear Regression204 Questions
Exam 13: Multiple Regression307 Questions
Exam 14: Business Analytics254 Questions
Select questions type
SCENARIO 2-8
The Stem-and-Leaf display represents the number of times in a year that a random sample of 100 "lifetime" members of a health club actually visited the facility. Stem Leaves 0 01222223333334445666666667789999 1 1111222234444555669999 2 00011223455556889 3 0000446799 4 011345567 5 0077 6 8 7 67 8 3 9 0247
-Referring to Scenario 2-8, if a frequency distribution with equal sized classes was made from this data, and the first class was "0 but less than 10," the class midpoint of the third class would be_.
(Essay)
4.8/5  (36)
(36)
SCENARIO 2-11
The ordered array below resulted from selecting a sample of 25 batches of 500 computer chips and determining how many in each batch were defective. Defects 1 2 4 4 5 5 6 7 9 9 12 12 15 17 20 21 23 23 25 26 27 27 28 29 29
-Referring to Scenario 2-11, construct a histogram for the defects data, using "0 but less than 5" as the first class.
(Essay)
4.8/5 (35)
Retailers are always interested in determining why a customer selected their store to make a purchase.A sporting goods retailer conducted a customer survey to determine why its customers shopped at the store.The results are shown in the bar chart below.What proportion of the customers responded that they shopped at the store because of the merchandise or the convenience? 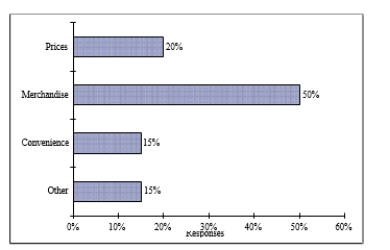
(Multiple Choice)
4.9/5 (33)
To compare one large set of numerical data to another, a distribution must be developed from the frequency distribution.
(Essay)
4.9/5 (37)
SCENARIO 2-5
The following are the duration in minutes of a sample of long-distance phone calls made within the continental United States reported by one long-distance carrier. Time(inMinutes) Relative Frequency 0 but less than 5 0.37 5 but less than 10 0.22 10 but less than 15 0.15 15 but less than 20 0.10 20 but less than 25 0.07 25 but less than 30 0.07 30 or more 0.02
-Referring to Scenario 2-5, if 10 calls lasted 30 minutes or more, how many calls lasted less than 5 minutes?
(Multiple Choice)
5.0/5 (31)
A survey of 150 executives were asked what they think is the most common mistake candidates make during job interviews.Six different mistakes were given.Which of the following is the best for presenting the information?
(Multiple Choice)
4.9/5 (34)
Percentage polygons are plotted at the boundaries of the class groupings.
(True/False)
4.9/5 (34)
One of the advantages of a pie chart is that it clearly shows that the total of all the categories of the pie adds to 100%.
(True/False)
4.8/5 (37)
SCENARIO 2-1
An insurance company evaluates many numerical variables about a person before deciding on an appropriate rate for automobile insurance.A representative from a local insurance agency selected a random sample of insured drivers and recorded, X, the number of claims each made in the last 3 years, with the following results. X f 1 14 2 18 3 12 4 5 5 1
-Referring to Scenario 2-1, how many total claims are represented in the sample?
(Multiple Choice)
4.7/5 (37)
You have collected information on the consumption by the 15 largest coffee-consuming nations.Which of the following is the best for presenting the shares of the consumption?
(Multiple Choice)
4.9/5 (32)
The larger the number of observations in a numerical data set, the larger the number of class intervals needed for a grouped frequency distribution.
(True/False)
4.8/5 (34)
Filters
- Essay(0)
- Multiple Choice(0)
- Short Answer(0)
- True False(0)
- Matching(0)