Exam 2: Organizing and Visualizing Variables
Exam 1: Defining and Collecting Data205 Questions
Exam 2: Organizing and Visualizing Variables212 Questions
Exam 3: Numerical Descriptive Measures163 Questions
Exam 4: Basic Probability171 Questions
Exam 5: Discrete Probability Distributions117 Questions
Exam 6: The Normal Distribution144 Questions
Exam 7: Sampling Distributions127 Questions
Exam 8: Confidence Interval Estimation187 Questions
Exam 9: Fundamentals of Hypothesis Testing: One-Sample Tests177 Questions
Exam 10: Two-Sample Tests300 Questions
Exam 11: Chi-Square Tests128 Questions
Exam 12: Simple Linear Regression204 Questions
Exam 13: Multiple Regression307 Questions
Exam 14: Business Analytics254 Questions
Select questions type
SCENARIO 2-7
The Stem-and-Leaf display below contains data on the number of months between the date a civil suit is filed and when the case is actually adjudicated for 50 cases heard in superior court.Stem Leaves 1 234447899 2 22223455678889 3 0011135778 4 02345579 5 112466 6 158
-Referring to Scenario 2-7, if a frequency distribution with equal sized classes was made from this data, and the first class was "10 but less than 20," the cumulative percentage of the second class would be _.
(Essay)
4.8/5  (36)
(36)
SCENARIO 2-17
The following table presents total retail sales in millions of dollars for the leading apparel companies over a two-year period in the past. APPAREL COMPANY Year 1 Year 2 Gap 1,159.0 962.0 TJX 781.7 899.0 Limited 596.5 620.4 Kohl's 544.9 678.9 Nordstrom 402.6 418.3 Talbots 139.9 130.1 Ann Taylor 114.2 124.8
-Referring to Scenario 2-17, construct a side-by-side bar chart.
(Essay)
4.7/5 (33)
Determining the class boundaries of a frequency distribution is highly subjective.
(True/False)
5.0/5 (37)
The Best Practices for Creating Visual Summaries recommend always including a scale for each axis if the chart contains axes.
(True/False)
4.8/5 (32)
When comparing two or more large sets of numerical data, the distributions being developed should use the same .
(Essay)
4.9/5 (30)
SCENARIO 2-6
A sample of 200 students at a Big-Ten university was taken after the midterm to ask them whether they went bar hopping the weekend before the midterm or spent the weekend studying, and whether they did well or poorly on the midterm.The following table contains the result. Did Well in Midterm Did Poorly in Midterm Studying for Exam 80 20 Went Bar Hopping 30 70
-Referring to Scenario 2-6, of those who did well on the midterm in the sample, percent of them went bar hopping the weekend before the midterm.
(Multiple Choice)
4.9/5 (32)
SCENARIO 2-11
The ordered array below resulted from selecting a sample of 25 batches of 500 computer chips and determining how many in each batch were defective. Defects 1 2 4 4 5 5 6 7 9 9 12 12 15 17 20 21 23 23 25 26 27 27 28 29 29
-Referring to Scenario 2-11, if a frequency distribution for the defects data is constructed, using "0 but less than 5" as the first class, the relative frequency of the "15 but less than 20" class wouldbe _.
(Essay)
4.8/5 (42)
SCENARIO 2-12
The table below contains the opinions of a sample of 200 people broken down by gender about the latest congressional plan to eliminate anti-trust exemptions for professional baseball. For Neutral Against Totals Female 38 54 12 104 Male 12 36 48 96 Totals 50 90 60 200
-Referring to Scenario 2-12, percent of the 200 were males who were neutral.
(Essay)
4.8/5 (37)
Apple Computer, Inc.collected information on the age of their customers.Suppose the youngest customer was 12 and the oldest was 72.To study the percentage of their customers who are below a certain age, it can use an ogive.
(True/False)
4.8/5 (40)
SCENARIO 2-13
Given below is the stem-and-leaf display representing the amount of detergent used in gallons (with leaves in 10ths of gallons) in a day by 25 drive-through car wash operations in Phoenix. 9\mid147 10\mid02238 11\mid135566777 12\mid223489 13\mid02
-Referring to Scenario 2-13, if a frequency distribution for the amount of detergent used is constructed, using "9.0 but less than 10.0 gallons" as the first class, the frequency of the "11.0 but less than 12.0 gallons" class would be .
(Essay)
4.7/5 (36)
SCENARIO 2-13
Given below is the stem-and-leaf display representing the amount of detergent used in gallons (with leaves in 10ths of gallons) in a day by 25 drive-through car wash operations in Phoenix. 9\mid147 10\mid02238 11\mid135566777 12\mid223489 13\mid02
-Referring to Scenario 2-13, construct a cumulative percentage polygon for the detergent data if the corresponding frequency distribution uses "9.0 but less than 10.0" as the first class.
(Essay)
4.8/5 (46)
SCENARIO 2-14
The table below contains the number of people who own a portable Blu-ray player in a sample of 600 broken down by gender. Own a Portable Blu-ray player Male Female Yes 96 40 No 224 240
-Referring to Scenario 2-14, construct a table of column percentages.
(Essay)
4.9/5 (39)
Given below is the scatter plot of the number of employees and the total revenue ($millions) of 20 U.S.companies.Companies that have higher numbers of employees appear to also have higher total revenue. 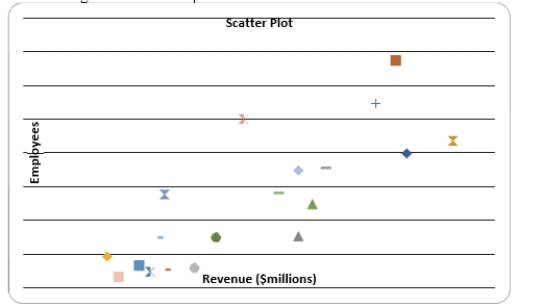
(True/False)
4.8/5 (33)
You have collected information on the market share of 5 different search engines used by U.S.Internet users in a quarter.Which of the following is the best for presenting the information?
(Multiple Choice)
4.9/5 (37)
In general, a frequency distribution should have at least 8 class groups but no more than 20.
(True/False)
4.9/5 (39)
A professor of economics at a small Texas university wanted to determine what year in school students were taking his tough economics course.Shown below is a pie chart of the results.What percentage of the class took the course prior to reaching their senior year? 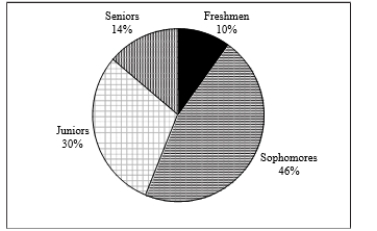
(Multiple Choice)
4.9/5 (36)
SCENARIO 2-15
The figure below is the ogive for fat (in grams) for a sample of 36 pizza products where the upper boundaries of the intervals are: 5, 10, 15, 20, 25, and 30.
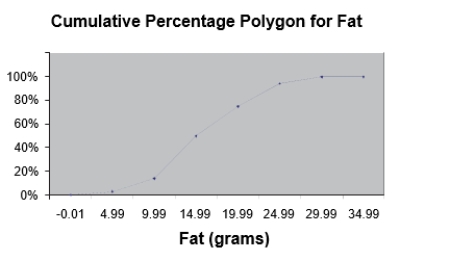 -Referring to Scenario 2-15, roughly what percentage of pizza products contains less than 10 grams of fat?
(Multiple Choice)
4.9/5 (41)
SCENARIO 2-13
Given below is the stem-and-leaf display representing the amount of detergent used in gallons (with leaves in 10ths of gallons) in a day by 25 drive-through car wash operations in Phoenix. 9\mid147 10\mid02238 11\mid135566777 12\mid223489 13\mid02
-Referring to Scenario 2-13, construct a relative frequency or percentage distribution for the detergent data, using "9.0 but less than 10.0" as the first class.
(Essay)
4.9/5 (31)
SCENARIO 2-14
The table below contains the number of people who own a portable Blu-ray player in a sample of 600 broken down by gender. Own a Portable Blu-ray player Male Female Yes 96 40 No 224 240
-Referring to Scenario 2-14 of the females in the sample, percent owned a portableBlu-ray player.
(Essay)
4.9/5 (32)
A research analyst was directed to arrange raw data collected on the yield of wheat, ranging from 40 to 93 bushels per acre, in a frequency distribution.He should choose 30 as the class interval width.
(True/False)
4.9/5 (39)
Filters
- Essay(0)
- Multiple Choice(0)
- Short Answer(0)
- True False(0)
- Matching(0)