Exam 2: Organizing and Visualizing Variables
Exam 1: Defining and Collecting Data205 Questions
Exam 2: Organizing and Visualizing Variables212 Questions
Exam 3: Numerical Descriptive Measures163 Questions
Exam 4: Basic Probability171 Questions
Exam 5: Discrete Probability Distributions117 Questions
Exam 6: The Normal Distribution144 Questions
Exam 7: Sampling Distributions127 Questions
Exam 8: Confidence Interval Estimation187 Questions
Exam 9: Fundamentals of Hypothesis Testing: One-Sample Tests177 Questions
Exam 10: Two-Sample Tests300 Questions
Exam 11: Chi-Square Tests128 Questions
Exam 12: Simple Linear Regression204 Questions
Exam 13: Multiple Regression307 Questions
Exam 14: Business Analytics254 Questions
Select questions type
SCENARIO 2-7
The Stem-and-Leaf display below contains data on the number of months between the date a civil suit is filed and when the case is actually adjudicated for 50 cases heard in superior court.Stem Leaves 1 234447899 2 22223455678889 3 0011135778 4 02345579 5 112466 6 158
-Referring to Scenario 2-7, the civil suit with the fourth shortest waiting time between when the suit was filed and when it was adjudicated had a wait of months.
(Essay)
4.8/5  (22)
(22)
SCENARIO 2-8
The Stem-and-Leaf display represents the number of times in a year that a random sample of 100 "lifetime" members of a health club actually visited the facility. Stem Leaves 0 01222223333334445666666667789999 1 1111222234444555669999 2 00011223455556889 3 0000446799 4 011345567 5 0077 6 8 7 67 8 3 9 0247
-Referring to Scenario 2-8, if a frequency distribution with equal sized classes was made from this data, and the first class was "0 but less than 10," the relative frequency of the last class would be_.
(Essay)
4.8/5 (29)
SCENARIO 2-12
The table below contains the opinions of a sample of 200 people broken down by gender about the latest congressional plan to eliminate anti-trust exemptions for professional baseball. For Neutral Against Totals Female 38 54 12 104 Male 12 36 48 96 Totals 50 90 60 200
-Referring to Scenario 2-12, if the sample is a good representation of the population, we can expect percent of the population will be males.
(Essay)
4.9/5 (42)
You have collected data on the number of U.S.households actively using online banking and/or online bill payment over a 10-year period.Which of the following is the best for presenting the data?
(Multiple Choice)
4.8/5 (40)
SCENARIO 2-14
The table below contains the number of people who own a portable Blu-ray player in a sample of 600 broken down by gender. Own a Portable Blu-ray player Male Female Yes 96 40 No 224 240
-Referring to Scenario 2-14, of those who owned a portable Blu-ray player in the sample,percent were females.
(Essay)
4.8/5 (39)
SCENARIO 2-15
The figure below is the ogive for fat (in grams) for a sample of 36 pizza products where the upper boundaries of the intervals are: 5, 10, 15, 20, 25, and 30.
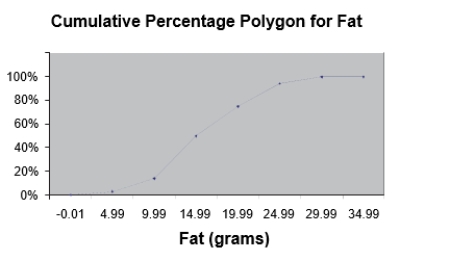 -Referring to Scenario 2-15, what percentage of pizza products contains between 10 and 25 grams of fat?
(Multiple Choice)
4.9/5 (40)
The sum of cumulative frequencies in a distribution always equals 1.
(True/False)
4.8/5 (32)
SCENARIO 2-18
The stem-and-leaf display below shows the result of a survey on 50 students on their satisfaction with their school with the higher scores represent higher level of satisfaction. 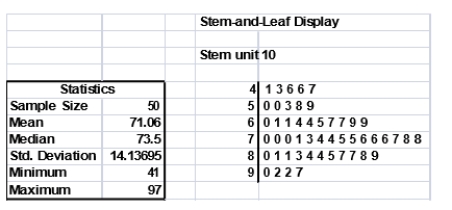 -Referring to Scenario 2-18, if a student is randomly selected, his/her most likely level of satisfaction will be in the 60s among the 40s, 50s, 60s, 70s, 80s and 90s.
(True/False)
4.8/5 (30)
SCENARIO 2-14
The table below contains the number of people who own a portable Blu-ray player in a sample of 600 broken down by gender. Own a Portable Blu-ray player Male Female Yes 96 40 No 224 240
-Referring to Scenario 2-14, of the females in the sample, percent did not own a portable Blu-ray player.
(Essay)
4.9/5 (37)
A histogram can have gaps between the bars, whereas bar charts cannot have gaps.
(True/False)
4.9/5 (43)
Apple Computer, Inc.collected information on the age of their customers.Suppose the youngest customer was 12 and the oldest was 72.To study the distribution of the age among its customers, it is best to use a pie chart.
(True/False)
4.8/5 (31)
A side-by-side bar chart is two histograms plotted side-by-side.
(True/False)
4.8/5 (35)
SCENARIO 2-9
The frequency distribution below represents the rents of 250 randomly selected federally subsidized apartments in a small town. Rentin \ Frequency 1,100 but less than 1,200 113 1,200 but less than 1,300 85 1,300 but less than 1,400 32 1,400 but less than 1,500 16 1,500 but less than 1,600 4
-Referring to Scenario 2-9, percent of the apartments rented for $1,400 or more.
(Essay)
4.7/5 (30)
You have collected data on the approximate retail price (in $) and the energy cost per year (in $)of 15 refrigerators.Which of the following is the best for presenting the data?
(Multiple Choice)
4.9/5 (31)
A is a summary table in which numerical data are tallied into class intervals or categories.
(Essay)
5.0/5 (36)
SCENARIO 2-13
Given below is the stem-and-leaf display representing the amount of detergent used in gallons (with leaves in 10ths of gallons) in a day by 25 drive-through car wash operations in Phoenix. 9\mid147 10\mid02238 11\mid135566777 12\mid223489 13\mid02
-Referring to Scenario 2-13, if a percentage histogram for the detergent data is constructed,using "9.0 but less than 10.0 gallons" as the first class, what percentage of drive-through car wash operations use less than 12 gallons of detergent in a day?
(Essay)
4.7/5 (38)
In general, grouped frequency distributions should have between 5 and 15 class intervals.
(True/False)
4.8/5 (41)
SCENARIO 2-7
The Stem-and-Leaf display below contains data on the number of months between the date a civil suit is filed and when the case is actually adjudicated for 50 cases heard in superior court.Stem Leaves 1 234447899 2 22223455678889 3 0011135778 4 02345579 5 112466 6 158
-Referring to Scenario 2-7, percent of the cases were adjudicated within the first 2 years.
(Essay)
4.8/5 (37)
SCENARIO 2-9
The frequency distribution below represents the rents of 250 randomly selected federally subsidized apartments in a small town. Rentin \ Frequency 1,100 but less than 1,200 113 1,200 but less than 1,300 85 1,300 but less than 1,400 32 1,400 but less than 1,500 16 1,500 but less than 1,600 4
-Referring to Scenario 2-9, the percentage of apartments renting for less than $1,400 is .
(Essay)
4.8/5 (30)
SCENARIO 2-12
The table below contains the opinions of a sample of 200 people broken down by gender about the latest congressional plan to eliminate anti-trust exemptions for professional baseball. For Neutral Against Totals Female 38 54 12 104 Male 12 36 48 96 Totals 50 90 60 200
-Referring to Scenario 2-12, percent of the 200 were against the plan.
(Essay)
4.8/5 (34)
Filters
- Essay(0)
- Multiple Choice(0)
- Short Answer(0)
- True False(0)
- Matching(0)